
A curated roundup of marketing analytics news, tools and ideas — with a focus on the Google analytics stack and the intersection of AI and analytics.
Building Performance Reports with an LLM: Faster, Cheaper, but Not Better
“Get ready to cancel your [Looker/Power BI/Tableau/etc.] license, because I’m going to show you how to build a dashboard in minutes with AI.”
You’ve probably heard some version of this on reddit, LinkedIn, Slack or wherever you stay on top of trends. If you haven’t, keep reading, because I include a link to an example below 🙂
I’m having a lot of fun building solutions with AI, but there are two aspects to this trend that I am puzzling over:
- Do we actually need more dashboards?
- How much value creation happens in the build process versus dashboard delivery?
Do we actually need more dashboards?
I’ve built hundreds of dashboards over the last 15 or so years, and in that time have developed a private measure for evaluating dashboard success:
Do people spend more time looking at the dashboard than I spent building it?
That may feel like a low bar, but IMO a majority of dashboards don’t meet it. My POV is mostly based on intuition, but I have put tracking in place on some dashboards, and the usage statistics are depressing.
I do think dashboards can be both useful and used, but that usually only happens when the builder(s) and the user(s) are in close and continuous communication. “Build a dashboard in minutes” feels to me like solving the wrong problem. Instead: “Spend the same amount of time, but use AI to improve relevance, reliability, usability, accessibility, and responsiveness to users” is solving the right problem. But I’ll allow, it doesn’t roll off the tongue quite as nicely.
How much value creation happens in the build process versus dashboard delivery?
Ten-ish years ago, my agency would spend the first week of the month creating and delivering performance reports for clients. We deliberated on the obvious question: if we spent less time reporting, and more time actually improving performance, wouldn’t our clients be better off?
No.
We experimented with backing off on reporting, and three things happened:
- People felt less accountable for results.
- We actually did less impactful work, because part of the reporting process was coming up with the list of optimizations planned for the month ahead. Lacking a thought-out plan, channel managers defaulted to their go-to tactics month after month.
- Tracking broke and no one knew.
So it’s hard to say how much our clients got out of reading our reports, but they were getting a lot of value whether they read them or not.
Today, an LLM can produce a detailed report or dashboard and make it look like we are doing our job, but if we don’t spend the time to understand and critically evaluate what we are reporting, we lose a sense of accountability, and accept and pass on results that may or may not be accurate.
I came across a fascinating paper describing research on this phenomenon, which the authors call “cognitive surrender”. Their findings are very relevant to the job of an analyst. I share the research with three takeaways for marketing data analysts here: Cognitive Surrender: Implications for Doing Analysis with AI.
Now, on with my roundup of recent news and ideas.
Nico’s latest video, “Using AI for Marketing Data Analysis: When to Trust the Robots,” is now live.
Product Updates
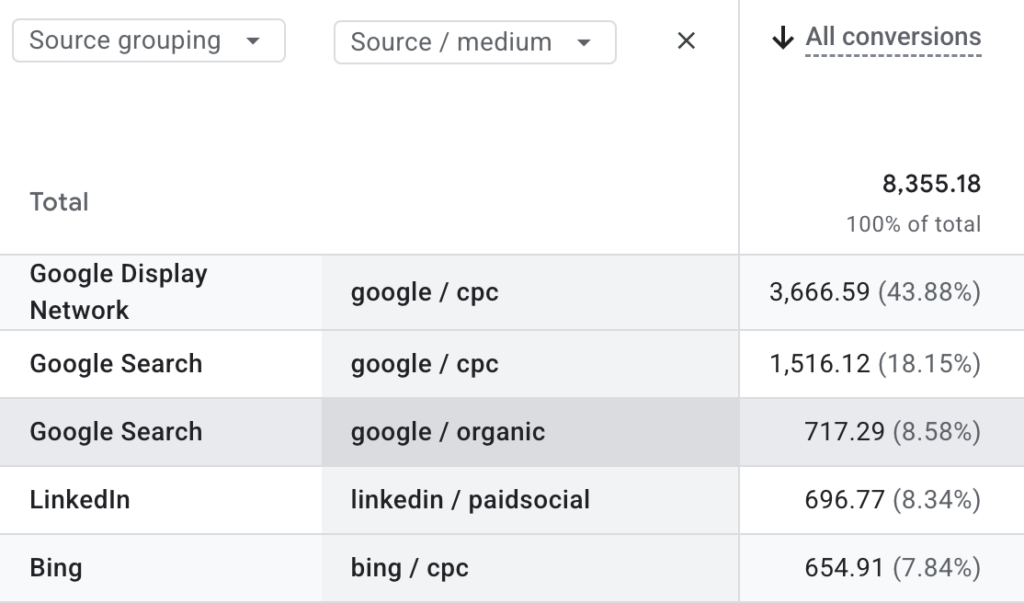
- GA: A new Source grouping field has been added to the Advertising reporting section. This was announced in June, but I didn’t find it in the wild until recently. The field is not available in regular reporting yet. I like that it breaks out Google Ads into different channels, but it lumps organic and paid search together, and does the same with social platforms. I’m going to continue relying on channel groupings and source / medium until they get the kinks worked out.
- Google Search Console now reports when your YouTube, X, TikTok and Instagram content shows up in Google Search results. Unfortunately, you have to add them as separate properties and the data is not yet available via the Search Analytics API, but this is great data for understanding your real visibility in Google.
AI-assisted analysis
- Build A Live Analytics Dashboard In Under 3 mins, Britney Muller
Per above, I have mixed feelings about this approach. But it does actually work, and Claude Cowork + Netlify is a bit of a superpower. Or it’s cocaine. Scroll down to get the joke. - using AI without giving up control, Alex Velez, storytelling with data
A walkthrough of building and refining charts using Claude for PowerPoint, with some general data viz advice along the way. Big improvement over the charts-as-images you get from the LLM chat window. - The context engineering playbook, nao
If you didn’t get the memo, prompt engineering is sooooo 2025. It’s all about context engineering now and this is a tested, step-by-step plan for building a context layer to improve LLM accuracy and usefulness. And check out this interview with Claire Gouze, the CEO of nao, to get more context on the context.
Data visualization & reporting
- The 90/90 rule for the dashboard dumpster, Better Than Random
Four rules for ensuring that you are not wasting time maintaining dashboards that no one uses.
Attribution & measurement
- Open-Source Geo-Experiment Tools — A Head-to-Head Simulation Study, Robson Tigre, Recast
A must-read if you are planning on doing geo-based incrementality testing. Compares: - Measurement is a business advantage, Barbara Galiza
Indirect measurement methods such as ‘how-did-you-hear-about-us’ and incrementality can reveal channels that are less competitive and therefore generate higher returns. The article also includes some practical tips for B2B measurement.
Ideas
- Data People Need Influence Without Authority, June Dershewitz
A lot of wisdom in a quick read. The basic idea is that analysts and data teams typically do work that relies on and/or impacts other branches of an organization, so they need to be good at building buy-in for their work. - The Forgotten Measure of Data Quality: Decision Quality, Sebastian Wernicke
For a long time I have advocated that marketing KPIs should map directly to an organization’s goals and objectives. I haven’t changed my mind, but reading this article made me realize there’s a layer missing. To be truly useful, KPIs need to map to decisions that impact goals and objectives. Including ‘decision value’ as a dimension in your metrics definition and governance puts business impact front and center.
Miscellaneous
- Understanding the AI economy, Google
“Google’s ATLAS is an expansive look at how people are using AI at work and in day-to-day life.” The research is based on Gemini usage, but doesn’t include usage via the Gemini APIs, Google Workspace integration or AI overviews. Given that those are the main ways I interact with Gemini, it doesn’t feel quite “expansive” enough. Nonetheless, they have access to data that is not available to just any old researcher, and the actual research paper has a lot of interesting stats. - A cocaine skeptic starts an unwise habit, Danielle Navarro
A personal perspective on AI-assisted writing and coding. Putting it under Miscellaneous instead of AI-assisted Analysis because it’s not meant to be a blueprint or how-to. I enjoyed it because they write well and have a unique voice.