In this tutorial, we explore methods for analyzing a top content page – i.e. a page we are really interested in getting people to. The goal of this analysis will be to identify tactics for increasing engagement with the page. For this example, we will be looking at the contact page on the Two Octobers website.
If you are doing an analysis like this to share with colleagues, take screenshots as you go, and note down important metrics. Once you are done analyzing, you can go back and add a narrative to explain your findings.
Example 1 – where are visitors coming from?
In this step, we determine the sources of traffic that result in views of the content. This can tell us how to generate more overall views.
- Create a segment of people who have visited the page
- Click Add Segment > NEW SEGMENT
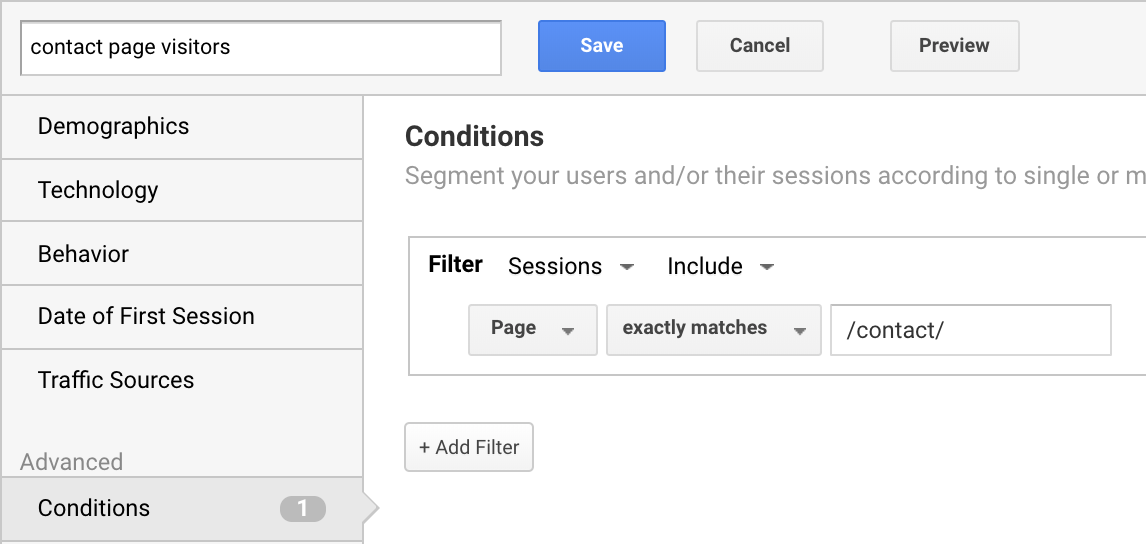
- Click on Conditions
- Set Page to exactly matches [your page] – the summary section to the right will show you if user sessions match this criteria
- Name the segment and save – I like to pick names that exactly describe the conditions, e.g. [your page] visitors
- Make sure the All Users segment is also applied
- Pick a longish date range (6 or 12 months), unless the page you are analyzing is new. More data is better for statistical significance.
- Look at the Acquisition > All Traffic > Source / Medium report – switch to Performance view – how do sources of traffic compare to overall traffic?
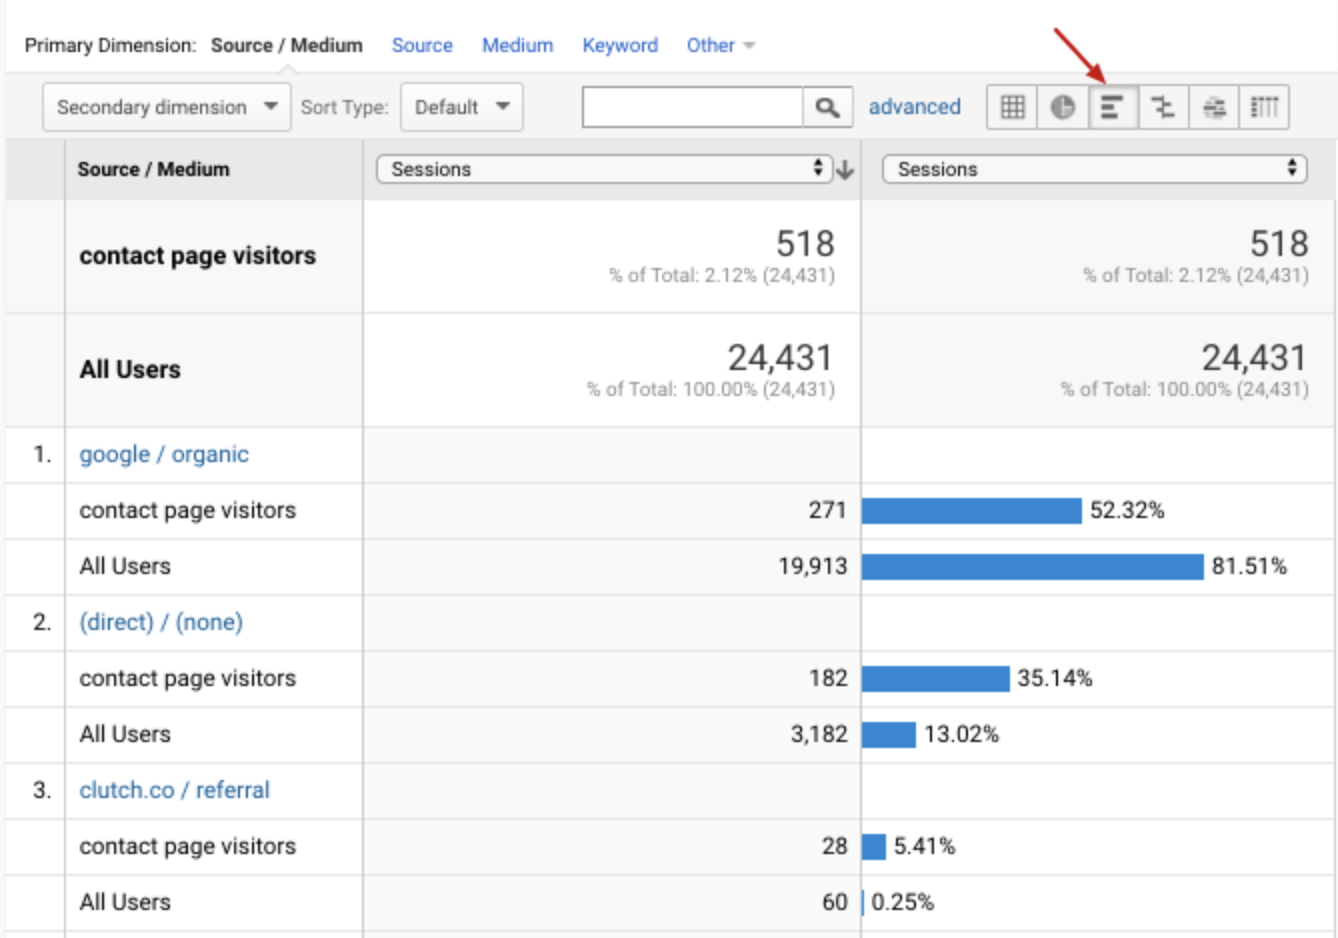
Takeaways from this data:
- While organic search drives a smaller percentage of contact page visitors than it does of overall traffic, it still accounts for more than half of contact page views.
- Clutch is a tiny percentage of overall traffic, but is the 3rd-highest source of traffic to the contact page. That is definitely worth further investigation!
Note that the segment above shows you all sessions that included a visit to the contact page, but did not necessarily start on that page. If you are interested in users that started their session on that page, change the segment to Landing Page starts with /contact/. In this case it is better to specify ‘starts with’ because external traffic often has tracking variables appended to the URL. The main risk of using ‘starts with’ instead of ‘exactly matches’ in all cases is that ‘starts with’ could match other pages such as /contact/thank-you.html.
Example 2 – how are visitors getting to the page?
In this step, we look at how traffic is flowing through the site to get to the page.
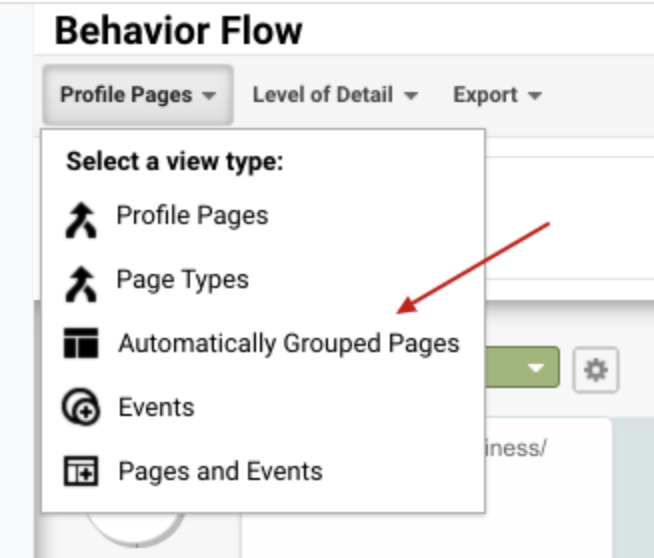
- Go to the Behavior > Behavior Flow report.
- Change the view to Automatically Grouped Pages
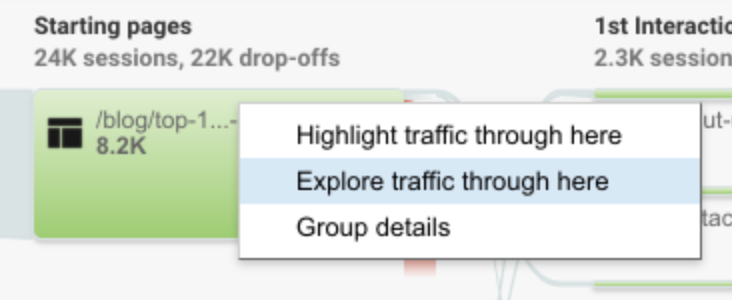
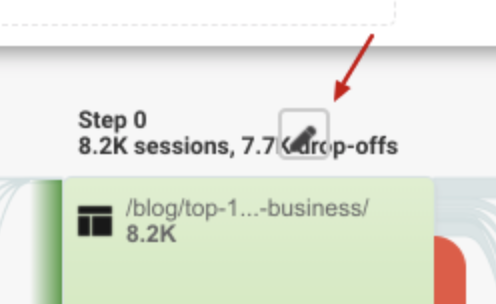
- Click on any green-highlighted page, and select Explore traffic through here. For some reason, this never seems to work the first time, so you may have to repeat this step to get it to work. When it works, you should see Step 0 in the middle of the screen.
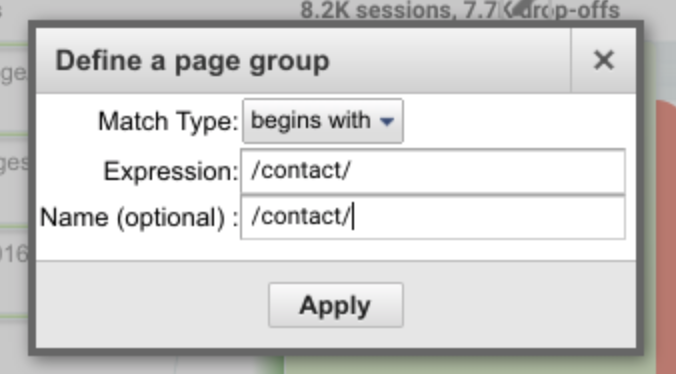
- Click on the little pencil icon by Step 0. Then specify the page you are analyzing – in our case /contact/.
- The resulting view shows the pages visitors view before and after visiting the target page. You can add more before and after pages by clicking ‘+step’ to the left and right of the diagram. This report is very interactive. If you mouse over any page, you get additional detail, and you can drag the report around. Below is a view of what it looks like. The red text was added to show entrances and exits to the page – unfortunately you have to mouse over the report to see those metrics otherwise.
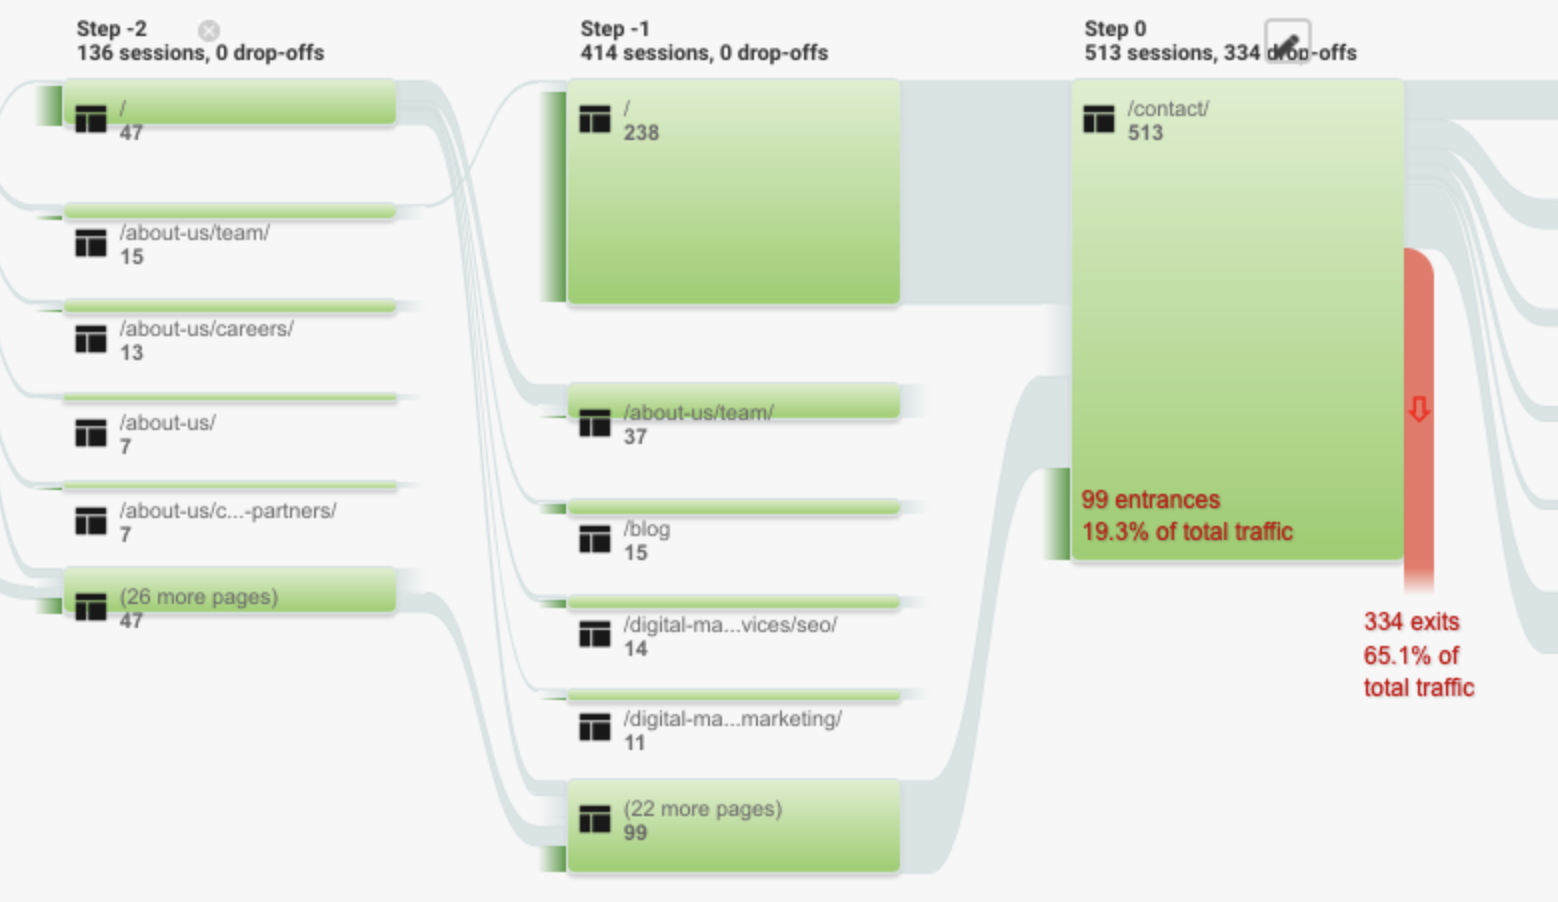
Things we can learn from this report:
- The paths visitors take to and from the page – this is helpful for getting a feeling for the intent of visitors to the page.
- The top referring pages. This tells us something about the intent of visitors when they get to the page.
- What’s missing? Are there pages on the site that are not driving traffic to the page and should be? If so, that can be an opportunity to provide more obvious links or calls-to-action on those pages.
Example 3 – how are visitors engaging with content?
In this example, we look at how visitors are engaging with the page – specifically, how many visitors are getting part way down the page and all of the way down the page.
- If you aren’t using Google Tag Manager, you should be! In any case, setting up scroll tracking is much more tedious without it.
- Assuming you don’t have scroll tracking set up already, follow the steps in Benjamin Mangold’s fabulous post How to track scroll depth with Google Tag Manager
- I also recommend setting up an event to track zero-percent scrolls. This event is equivalent to a page view, but it will make your scroll tracking report more useful. To do this, in Tag Manager:
- Add a new Google Analytics tag.
- Set Track Type to Event.
- For Category, use the same event category as your other scroll tracking events, the category is just ‘Scroll’ if you followed Benjamin’s post.
- Set the event action to 0%.
- Apply your Google Analytics settings variable. If you don’t know what this means, go here.
- Set Non-interaction Hit to TRUE.
- Apply the All Pages trigger.
- Save and Publish!
- If you are just getting scroll tracking set up, you’ll probably want to wait a week or two to accumulate data.
- Once you have some data, you are ready to analyze scroll depth! Benjamin Mangold also has a great webinar on this, but below is a cool report he doesn’t cover:
- In Google Analytics, go to Behavior > Events > Pages.
- Set the report type to Pivot
- Set Pivot by to Event Action
- Set Pivot metrics to Unique Events
- Add an Advanced Filter to include only Event Actions that contain a percent symbol. For our purposes, we have also applied a filter to include the /contact/ page, but you don’t strictly need to do this.
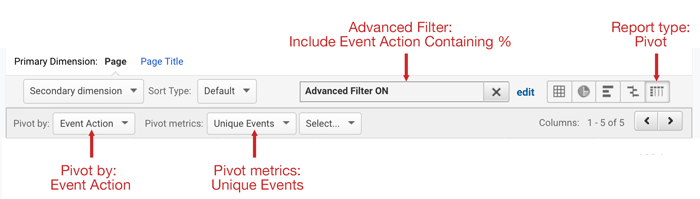
Voilá! If it all worked, your report should look something like this:

This shows the number of visitors to the page who scrolled 0% down the page, 25% down, etc. Note that if a visitor scrolled all the way down the page, they would be counted in all columns. In other words, to scroll 100%, a visitor first has to scroll 0%, 25%, 50%, and 75%.
You can also export this data to a spreadsheet to change these numbers to percentages of page visitors. This spreadsheet has a template for doing this. You will first need to make a copy of the page so you can edit it. Then export the results of this report and paste them to the ‘Scroll Percentage raw data’ tab. The percentage numbers will show up on the ‘Scroll Percentage report’ tab.

The diagram to the right was created in Photoshop, to visualize what these scroll percentages represent on the Contact page.
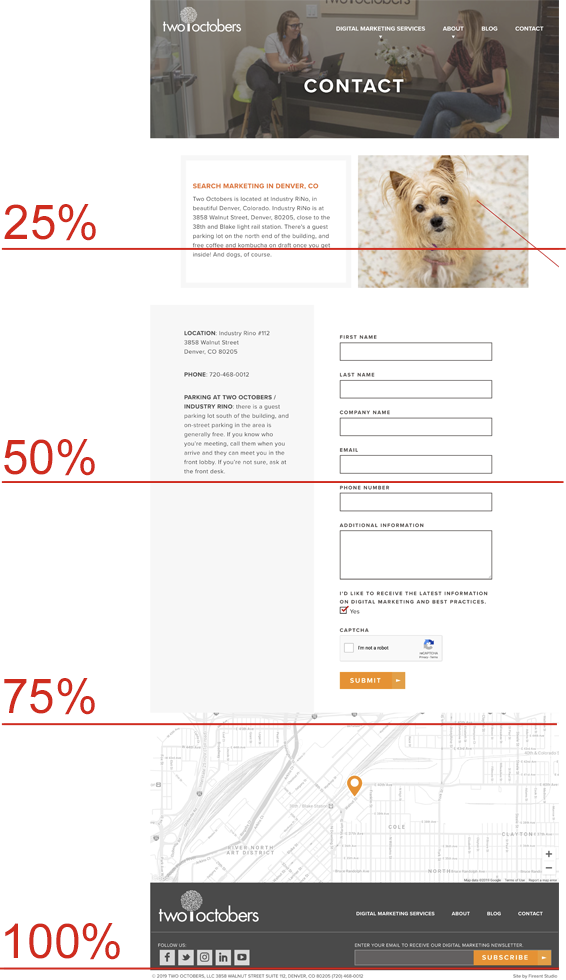
Takeaways from this data:
- Nearly half of people who visit this page get to the bottom of the form, which is not bad. Presumably many find what they are looking for when they see the location of the business, which is above the 25% line.
- We do lose about a third of people before the form, so it would be worth testing different calls to action at the top of the page to see if we can improve that number.
Recommendations for next steps:
- Lucky Orange and Hot Jar are tools that provide detailed heatmap data of page interactions, and can be very helpful for understanding where and why people are dropping off.
- Google Optimize is a free tool that integrates with Google Analytics and enables A/B testing of page modifications.