Acquisition reporting shows how website visitors perform, based on where they are coming from. Acquisition reporting includes the following sections:
- All Traffic – reports of all traffic to the website, organized by various dimensions. Detailed referral traffic reporting also falls in this section, for some reason.
- Google Ads – if Google Ads and GA are linked, these reports tie Google Ads campaigns, ad groups, ads and keywords to detailed website behavior.
- Search Console – links Google Search Console to Analytics. Search Console is a separate Google product that webmasters and SEOs use to analyze organic search performance. Search Console data is imported, but not linked to user behavior on the website
- Social – reports on traffic from social media sites. Limited by the fact that GA can’t track users in Facebook, Instagram, Twitter, etc.
- Campaigns – reporting of marketing campaigns that are set up to track in GA. Campaign is a dimension that can be set with UTM parameters, described below.
Default Metrics
Below is an example of the Acquisition > All Traffic > Source / Medium report, showing the default metrics that show up in this and most other reports.
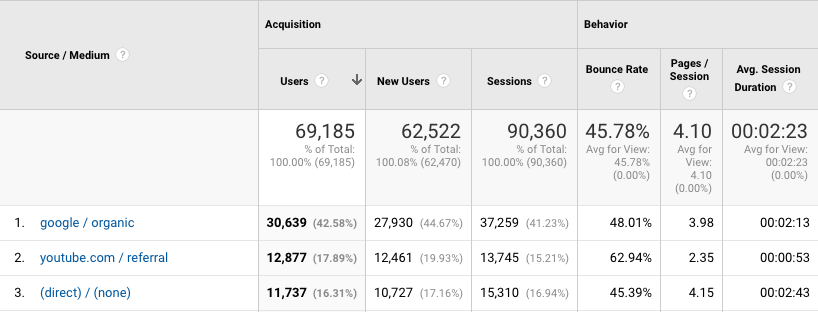
Following are descriptions of these metrics, but don’t forget that you can click on the question mark to the right of the metric to get a popup description.
- Users
Unique visitors to the property, as measured by the first-party cookie set by the Google Analytics tag. At this time, GA does not associate unique visitors across multiple devices or browsers, though it is possible to do this in some circumstances by configuring an optional User ID attribute when implementing the tracking code. - New Users
Users that visited a property for the first time during the selected reporting period. Because Google Analytics doesn’t track users across devices and browsers, it is hard to know what percentage of new users are actually new users, and what percent are previous visitors on a new device. - Sessions
A session is counted each time a user visits a property. If the user is idle for 30 minutes or more, then becomes active on the site again, a new session is counted. - Bounce Rate
In non-technical terms, a bounce is counted when a user visits the property, then leaves immediately. In technical terms, a bounce describes a single-interaction visit. This means that a single-page-view visit counts as a bounce, even if the visitor spends a significant amount of time on the page. A high bounce rate is generally viewed as an indication of poor traffic quality and/or page content. - Pages / Session
The average number of pages users visit during a session. A bounce counts as a one-page session. Pages / session is seen as an indication of engagement. - Avg. Session Duration
The average time from the first interaction to the last interaction for a session. A bounce counts as a zero-duration session. This metric is also used to measure engagement.
How GA Classifies Traffic
GA classifies inbound traffic to a property by source, medium and channel. Source represents where the traffic came from, medium is the type of traffic, and channel is a somewhat confusing conglomeration. GA classifies traffic automatically using the referrer field that is part of the HTTP request a browser makes when retrieving a web page. The referrer field contains the URL for the page you were on prior to visiting the page, assuming you clicked on a link to visit the page. In other words, if you are on xyz.com/this.html, and click on a link to go to abc.com/that.html, abc.com will get the referrer value of xyz.com/this.html in the HTTP request. If a visitor did not click on a link to get to a page, the referrer field is blank.
It is also possible to specify a value for source and medium using UTM parameters. More on that below.
Source
The value for source is usually the domain name of the referring page. For example, traffic coming from Facebook.com shows the source as facebook.com. In some cases, GA drops the .com (or .net, & etc.) portion of the domain name. For example, organic search traffic from Google.com just shows google as the source. If a visit does not have a referrer, the source is shown as “(direct)”.
GA source and medium classifications are always lower case, though you can use proper or upper case if you are setting source and medium with UTM parameters.
Medium
While medium is supposed to represent the category of inbound traffic, GA’s automated classification is limited to organic, referral, and “(none)”. Marketers often use UTM tags to classify other media such as social, cpc, email and affiliate traffic.
Channel
Channel groupings are similar in concept to medium, but do a little bit better job of classifying traffic, and can be configured to do much better. The default channel groupings mostly classify traffic according to the medium value, but referral traffic from social sites such as Facebook, Instagram and Twitter is counted in the Social channel. There are also channel groupings for Email, Affiliates, Display and Paid Search, but those only apply when UTM parameters are used to set medium to a corresponding value.
This page describes how the default channel groupings classify traffic: https://support.google.com/analytics/answer/3297892
It is also possible to create custom channel groupings. Custom channel groupings can be used to create more specific classifications. For example, they can separate paid social from organic social or branded search from non-branded.
UTM Parameters
The above definitions describe how GA automatically classifies traffic, but UTM parameters allow marketers to override default values for source and medium. A UTM parameter is a value that is appended to a landing page URL as a querystring. This is an example of a landing page URL without UTM parameters:
This is the same page with parameters:
Let’s say this landing page is linked to from a newsletter email, and a person reads the email in their Gmail account. The first URL would appear in Analytics with Source / Medium:
mail.google.com / referrer
The second URL would appear as:
newsletter / email
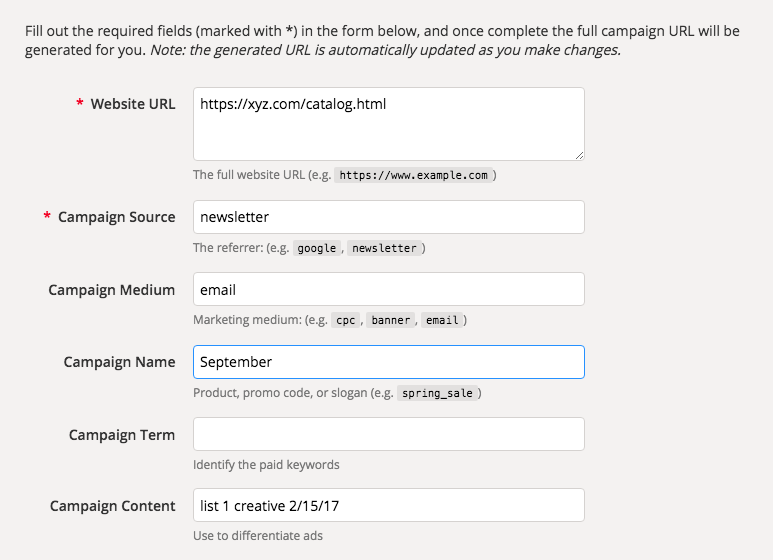
UTM parameters can also be used to track campaigns and keywords. Google has an online tool for adding UTM parameters to URLs:
The syntax of UTM parameters is not all that complicated, but the tool is very helpful for correctly formatting spaces and special characters so they don’t break the URL and show up properly in Analytics. Below is an example of the input and output of the tool:
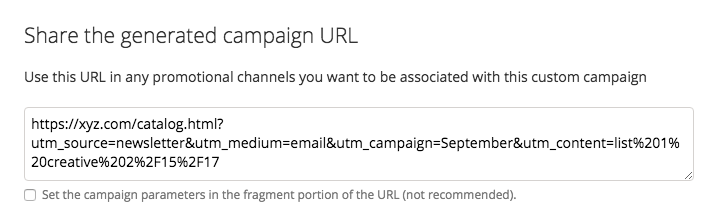
This is the output. The Campaign Content parameter can be used to track ad creative. Notice how the value has been reformatted.
Auto-tagging
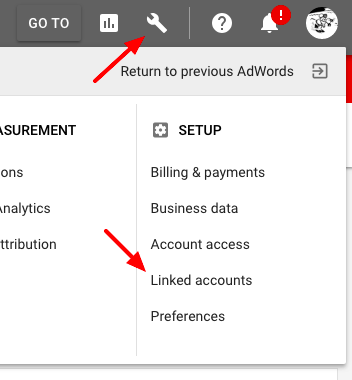
Google Ads has a setting that automatically tags all Google Ads traffic so it shows up as google / cpc in Analytics instead of google / organic. You can also link a Google Ads account to an Analytics account to report on keyword, cost and other data in Analytics. More on that below. To link accounts, click on the wrench icon in Google Ads, then Linked accounts. From there, click on Google Analytics, then select Link to the right of the GA account you want to link. The login you use for Google Ads will need to have access to the GA account for it to be visible.
Some other advertising platforms have built-in support for automatically tagging ad placements with UTM parameters as well.
Acquisition Reporting
Asking Questions, Hunting for Anomalies
When you are reviewing an Analytics account, think about the types of questions you want to answer. If you are a marketer, you want to know if you are targeting the right people with your marketing efforts, and whether or not they are doing what you want when they get to your site. Audience reporting gives you information about visitors, which can be useful when planning other marketing efforts or tailoring your messaging. Behavior reporting shows what visitors do when they get to a website. What content are visitors most interested in? What landing pages are most likely to lead to a conversion? Acquisition reporting is where you go to understand which of your marketing efforts are driving results.
It can be informative to browse around GA, to just get a feel for metrics, but it’s best to start with specific questions when doing analysis. Starting with a question forces you to think about how GA can be used to provide relevant data, rather than just letting the data wash over you. For example, if you ask the question: “how does paid search performance compare to organic?”, an obvious next step is to apply segments for paid search and organic, then look at some key reports. Spending a bit of time coming up with questions before you dig in will generally lead to more interesting results, and will likely compel you to explore more advanced capabilities of GA.
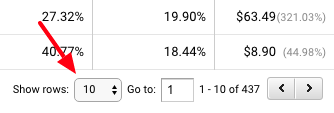
It is also a good idea to dig deeper than the top 10 results in each report. Interesting surprises often lurk further down in the data. Sort reports by engagement or conversion metrics to find performance outliers, and change the Show rows setting to see 50 or 100 rows of data.
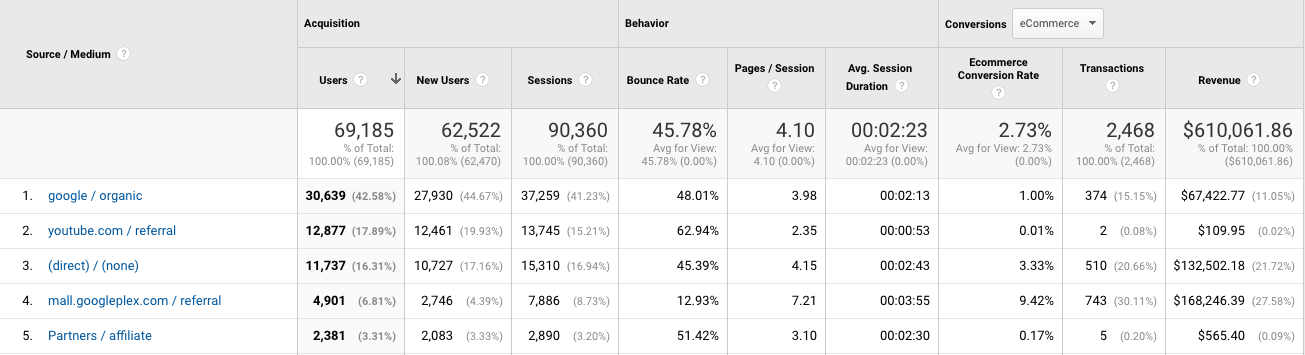
Report > Acquisition > All Traffic > Source/Medium
This report is good for answering the questions: “what are the top sources of traffic to my website?” and “which sources perform best?” Notice row 5 in the example below. It appears that affiliate partners have been given UTM parameters to add to URLs pointing to the property.
Explorer Tabs
Some reports have multiple tabs with different metrics on each tab. In the example below, the Goal Set 1 tab has been selected. This tab shows how traffic performs for each of the first 5 goals.

Reports > Acquisition > Google Ads
This section of reporting is good for answering all manner of questions related to paid search performance. The report below shows how each keyword performs. When Google Ads and GA are linked, these reports provide incredible depth of detail on keywords, ads, ad extensions, bid adjustments and a host of other targeting criteria. It’s worth clicking through each of the Google Ads reports just to see what’s possible.

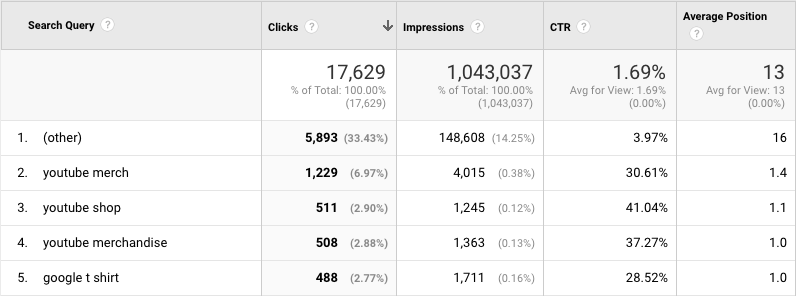
Reports > Acquisition > Search Console > Queries
Google Search Console is not part of Google Analytics, but the two can be linked. Search Console is a tool that provides webmasters and SEOs with data on how a website is performing in Google Search. By linking Search Console to GA, you can see some search console data in GA, but Search Console data is not tied to sessions in GA, so you don’t get engagement or conversion metrics in these reports. Below is a GA report showing how the GA demo site is performing in Google Search for various search queries.
Acquisition: Answering Questions with Data
Below are some of the business questions that acquisition reporting can answer. For most of these reports, you will want to set your date range to ensure a meaningful amount of data. For low-traffic sites, this may be 3 or 6 months.
Question: which sources of traffic result in the most engaged or highest converting visitors?
- Report: Acquisition > All Traffic > Source/Medium
- Business insight: look at Pages / Session and Goal Conversion Rate. Are there dramatic differences? Think about opportunities to expand the best performing sources. Are there things they could do to improve poor performers?
Question: what can we learn about people coming from the top marketing source?
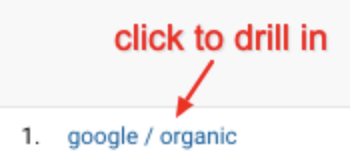
- Report: Acquisition > All Traffic > Source/Medium – click on the top Source / Medium (excluding direct / none) to isolate it, then add secondary dimensions such as Region (State), Device Category, Age, or other characteristics.
- Business insight: anything we learn about visitors can be helpful from a marketing perspective. For example, if we discover that most organic traffic is coming from outside of where we sell, we can value it as a source of traffic better. If we learn that most people visit on mobile devices, we can focus more on mobile UX and advertising opportunities.
Question: what keywords have driven the best ROI (cost per acquisition, ROAS, cost per page view, etc) for paid search over the last 30 days?
- Report: Acquisition > AdWords > Keywords – for this report to work, the business has to be running Google Ads and have Google Ads linked to Analytics
- Business insight: consider bidding more on top performing keywords to improve search campaign results, and look for opportunities to add similar keywords.
- Bonus: switch to Acquisition > AdWords > Search Queries, then add Keyword as a secondary dimension to how people’s actual searches map to purchased keywords.
Question: what channels are driving more traffic over time?
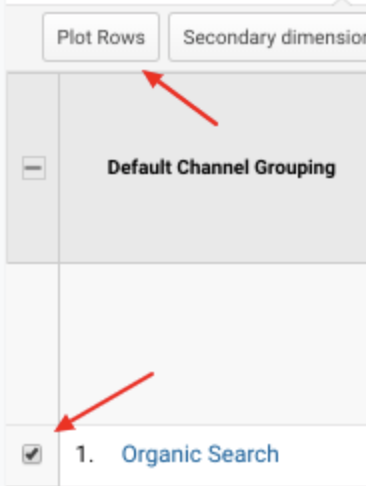
- Report: Acquisition > All Traffic > Channels – increase the date range to the last year. Change the time increment of the graph to Month. Then select a few of the top channels and Plot Rows to see each channel on the graph.
- Business insight: is organic search going up or down? If it’s going up, this is an indication that they are doing something right. If it’s going down, they should be looking at investing in SEO. What about other channels? Are there notable trends in Social, Paid Search or other marketing channels?

Question: are there any referring sites that stand out as traffic drivers?
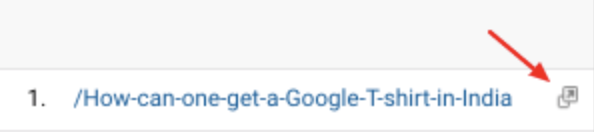
- Report: Acquisition > All Traffic > Referrals – click on a referrer to see referring pages. Click the icon to the right of the referral path to open the referring page in a browser.
- Business insight: there may be opportunities to partner with these sites, or buy advertising on these sites. They may also help you identify similar ways to obtain inbound links and traffic.