The behavior section of reporting in GA mostly shows how visitors interact with a web property. In this module, we will cover the following subsections of Behavior reporting:
- Events – interactions on a page, such as scrolls, clicks, video views and form inputs.
- Site Content – reporting on entrances, page views and exits by page.
- Behavior Flow – this is an interactive report that shows how visitors move through a property. It can provide useful insights, but is also a bit frustrating to use.
- Site Speed – how long it takes pages to load.
These sub-sections are also part of behavior reporting, but we will not be covering them in this module.
- Site Search – reports on what people are searching for on a property, if the property has a search bar. For this report to work, the syntax of query parameters on search result pages needs to be configured in Admin > View Settings > Site Search Settings.
- Publisher – reports for properties that serve Google Ads.
- Experiments – this used to be part of GA, now it is powered by Google Optimize.
Events
The standard Google Analytics tag tracks page views. You can also track on-page events in GA, by adding a bit more code to the page. Events send data (category, action, label) based on what a visitor does on a page.
Events provide a window into what visitors do on a page. They also give you the ability to collect structured data. Events are triggered by something that happens on a page, usually driven by a JavaScript event. Event tracking is often implemented by a web developer, because each event requires code to be added to a website. If Google Tag Manager (GTM) has been installed on a website, it is possible to implement events without writing code, though it is still a bit technical.
For more on the nitty-gritty of setting up events, see this Google dev guide: https://developers.google.com/analytics/devguides/collection/analyticsjs/events
What Can be Tracked with Events?
Events can be used to track when people click a link and leave a site.

Or when they initiate an interaction such as a chat window. JavaScript is typically used to trigger Google Analytics events, and JavaScript can track mouse movements, clicks, scrolls and typing.
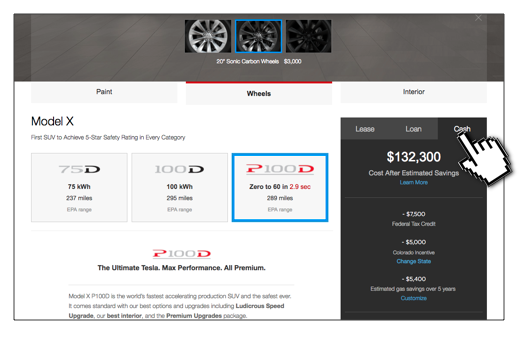
If there’s any type of interactivity on a page, it is a good idea to track it as an event. There’s no downside to tracking something as an event, so in general it’s better to collect any and all interaction data so it’s available for later analysis.
Other things that can be tracked as events:
- Video views
- Form field fills
- Interactions with carousels and sliders
- Scrolling
- Anything that is associated with a JavaScript event
Behavior Reporting
Report > Behavior > Events
Unlike goals, events are not available as metrics in most reports. You have to go to the Events reports to get details on event interactions. Below is an example of an event report for a property (not the demo site). The Event Action has been added as a secondary dimension, so both Category and Action can be viewed together. Annoyingly, there is not a default report that shows event categories, actions and labels as dimensions in a single view.
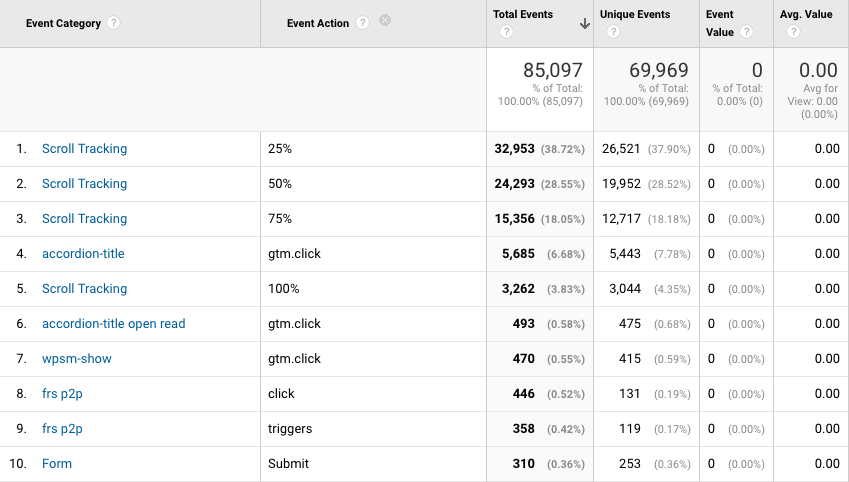
It is necessary to add in secondary dimensions or segments to correlate events to audience characteristics or traffic sources.
Reports > Behavior > Site Content
The site content reports show visitor behavior by page view. They are useful for answering questions like, “what is the most visited content on my site?” or “what pages have the highest exit rates?” The answers to these questions are useful for planning and optimizing website content.

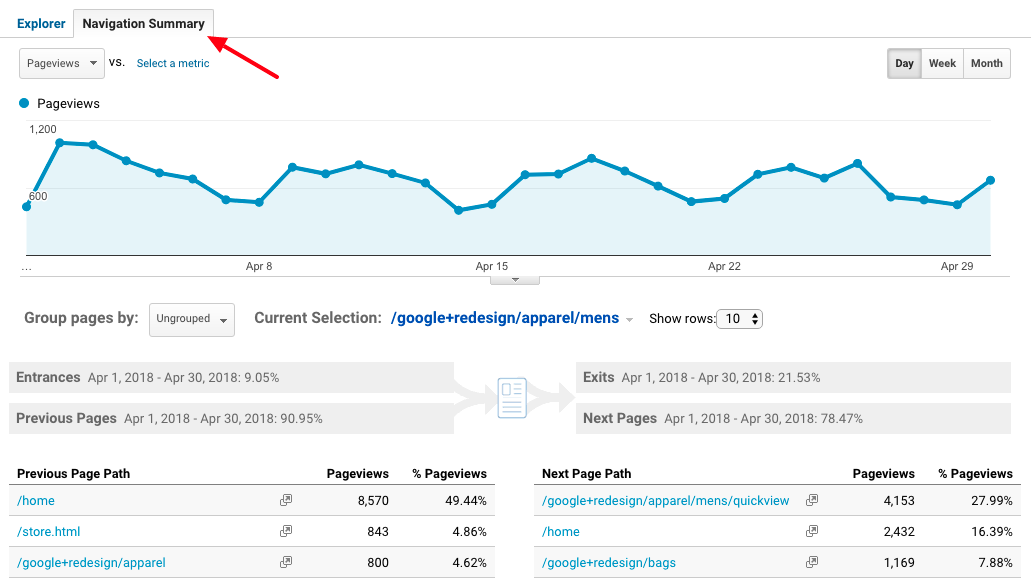
From the site content reports you can select the tab Navigation Summary to see the pages users visit before and after a given page. This can be very helpful for understanding and designing for the intent of visitors. For example, if you find that people often go from a catalog page to a sale page, it might make sense to incorporate sale items into the catalog page.
Report > Behavior > Behavior Flow
The behavior flow report looks pretty, but it is fairly difficult to use. The idea is that you can get a feel for how people flow through a site, but the information is not presented in a very intuitive way, and it can’t really be shared with people who are not familiar with the report. Below is an example from the demo site. Mousing-over a page pops up statistics about the page, which is sort of handy, but also makes it difficult to compare data.
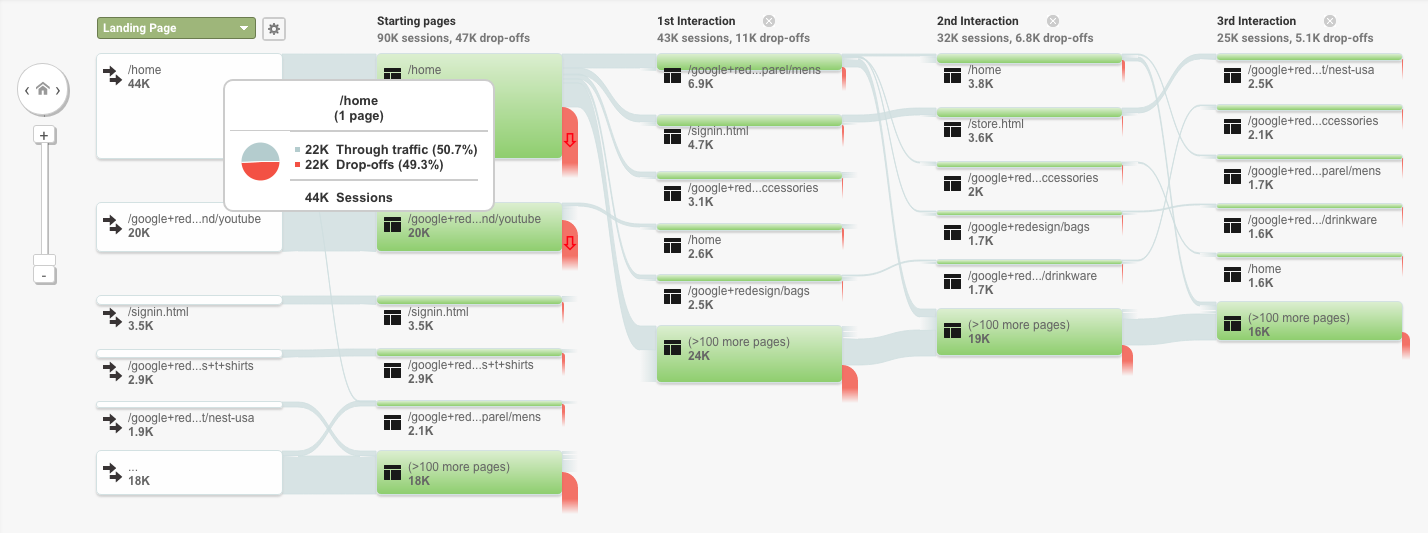
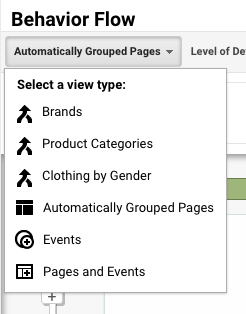
The report is very interactive – there are a number of things you can do to narrow down or expand on data. One setting of particular note: at the top left of the report is a drop down with options for what data to view in the report. You can look at individual pages, but you can also create groupings of similar pages, or view interactions with events.
For more on creating content groupings, see: https://support.google.com/analytics/answer/2853546?hl=en
Site Speed
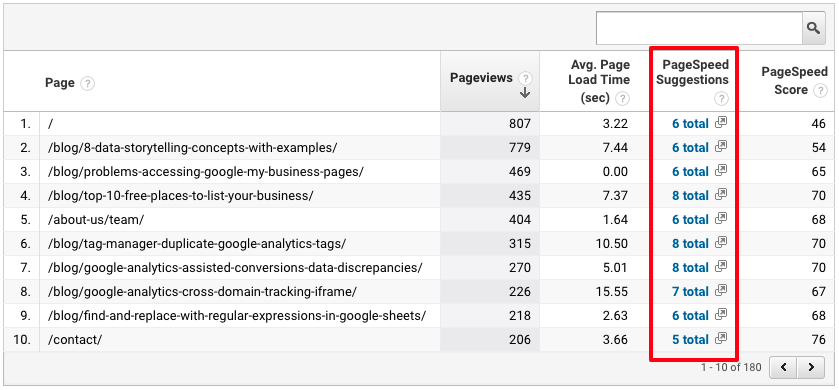
Site speed isn’t really a category of behavior, but it does relate to behavior, and is important to monitor. Google has acknowledged that page speed is a factor in organic search ranking[4], and faster-loading pages provide better user experience. Below is an example of a Site Speed > Speed Suggestions report. This report links to specific suggestions to improve load speed. These suggestions often point to easy fixes that can have a positive impact, such as poorly-optimized images. For a more comprehensive analysis, the Lighthouse audit reports that are part of Chrome Developer Tools are an excellent and free option.
Page Analytics
The Page Analytics Chrome Extension shows Google Analytics detail about a page when viewed in Chrome. To see Analytics data, you need to be logged in to Chrome with a login that has Analytics access to the site you are viewing. This view is particularly useful when you are evaluating website opportunities or page design, as it shows what people are likely to click on from a given page. It can get a little wonky with navigation and links that display dynamically based on user-interaction, such as drop-down menus.

Behavior: Answering Questions with Data
Below are some of the business questions that behavior reporting can answer.
Question: where do visitors go from the home page?

- Report: Behavior > Site Content > All Pages – Navigation Summary. (Typically, the home page is the highest-traffic page, in which case the Navigation Summary will default to it. If it is not the highest-traffic page, click on the home page listing before clicking on Navigation Summary.
- Business insight: are people generally going from the home page to other high-value pages on the site? If not, think about ways to make it easier/more compelling for visitors to continue, such as more visible links and more compelling calls to action.
Question: are there any unusually slow pages on the site?
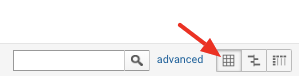
- Report: Behavior > Site Speed > Page Timings. This report defaults to the comparison view. It’s a bit confusing to read this way. Click to the Data view to see more details about each page.
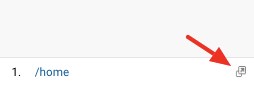
- Business insight: page speed significantly impacts user experience and mobile speed in particular is an important organic search ranking signal. Test a few of the slower pages you find in this tool: https://www.thinkwithgoogle.com/feature/testmysite/ to get actionable suggestions for improving speed. In GA, you can click on the icon to the right of the page name to open the page in a browser window and get the full URL.
Question: what landing pages are most likely to lead to conversion?
- Report: Behavior > Site Content > Landing Pages – set Conversions to All Goals
- Business insight: evaluate the pages with the highest conversion rates. Click on the Goal Conversion Rate column to sort descending, but be wary of drawing conclusions from pages with very few clicks.
Do top-performing pages have something other pages do not have? Should marketing be focused on driving more traffic to these pages? - Bonus: add Device Category as a secondary dimension to see if mobile user experience differs from desktop.
Question: what pages get the most visits?
- Report: Behavior > Site Content > All Pages
- Business insight: evaluate the pages with the most views – visit them in your browser and think about the experience of a prospect landing there. Do they have a compelling call to action? How could the website get more value out of these pages?
Question: what are the top exit pages?
- Report: Behavior > Site Content > Exit Pages – this report defaults sorts to show the pages with the most exits.
Business insight: do the top exit pages make sense? For example, you would expect people to leave from an order complete or contact us page. If not, look at the pages and think about reasons people might be leaving. It might help to add in secondary dimensions to learn more about people leaving from the page. For example, adding Device Category might indicate that poor mobile user experience is a factor.