In this module, we will cover how to set up goals in GA, and some of the reports in the Conversions section of reporting that help us understand the whos and hows of conversion behavior.
We’ll be using the Google Analytics demo account in the examples in this module. The demo account is a GA property configured on a real, live website: https://shop.googlemerchandisestore.com/. The store gets a lot of Google employees as customers, which makes some of the data a bit atypical compared to other ecommerce sites. For example, a lot of revenue comes from Mountain View, California. To access the demo account, go here:
Goal Conversions
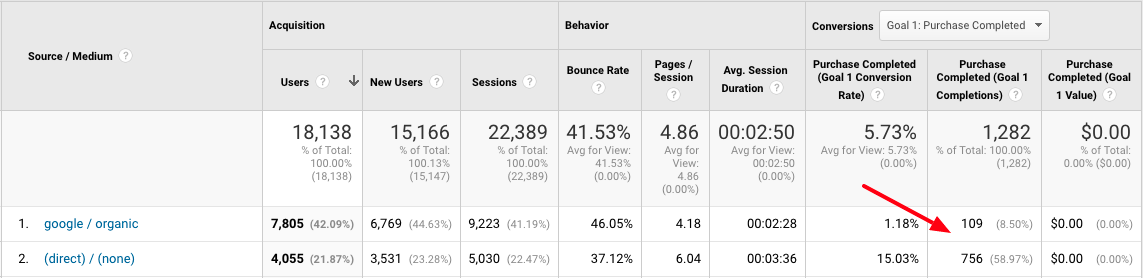
Goals in Google Analytics are used to measure actions or thresholds that visitors complete on a website. Goal counts show up in most reports, and provide an indication of how well different dimensions perform. In the example below, the Acquisition > All Traffic > Source/Medium is shown, with columns to the right showing Purchase Completed goals. In this example, we see that 109 google / organic visitors completed purchases, compared to 756 (direct) / (none) visitor purchase completions. Most notably, the third column from the right shows that 15.03% of direct visitors completed the goal, in comparison to 1.18% of google / organic visitors.
Goal conversions in Google Analytics are most often triggered by specific page views or events, though it is also possible to track a threshold number of page views or time on site as a goal. The latter two make sense for web publishers who are primarily looking for engagement, such as news websites or industry portals. For most businesses, more tangible outcomes such as acquired leads or online orders are the goals worth tracking.
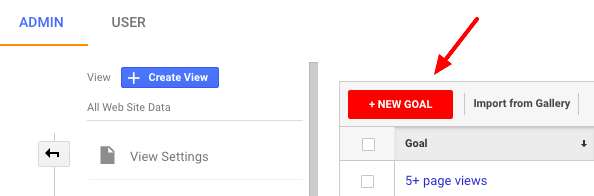
To create a goal, go to the view section of the Admin interface (you get to the Admin interface by clicking on the gear icon in the lower-left-hand part of the screen). Goals are specific to a view.
Admin > View > Goals > New Goal:
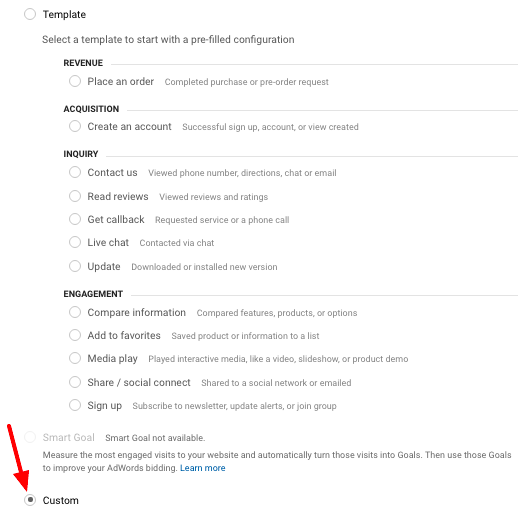
GA has a number of pre-built templates set up for goals. These are interesting to look at as examples, but don’t really make goal setup any easier. Select Custom to have complete control over goal configuration.
Next, you specify a name for the goal and select which type of goal it will be.
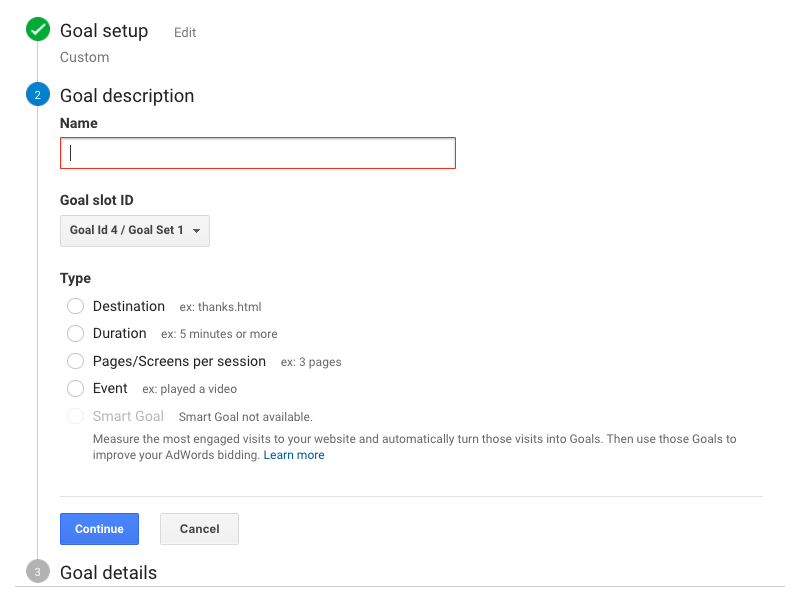
The next step varies depending on which type you choose.
Types of Goals
Destination
This is probably the most commonly used goal type. With a destination goal, you specify a page that constitutes a goal. For example, if a contact us form takes the user to the page /contact/thank-you.html when submitted, you can set this up as a goal.
Other examples of destination conversion goals:
- A confirmation page for any kind of lead form
- An order confirmation page
- A product detail page
Note that not all website contact or lead forms have confirmation pages. It has become more common to show a confirmation message without taking the user to a different page. In those circumstances, an event goal is required.
Duration and Pages/Screens per session
These goal types are fairly similar to each other and useful for measuring engagement versus the completion of an action. In either case, you set a threshold and when a visitor exceeds the threshold a goal completion is counted. For example, you could set a goal to count when a user visits at least five pages. There is not typically anything meaningful about the exact number of pages, it is just a measure of more engaged visitors.
Event
This is the most powerful and flexible goal type, but requires a bit more work to set up. Event goals are triggered by a match to one or more event fields. Because events can be triggered by any interaction with a page, including mouse clicking, hovering, scrolling, or form field entry, event goals can fire based on any of those interactions.
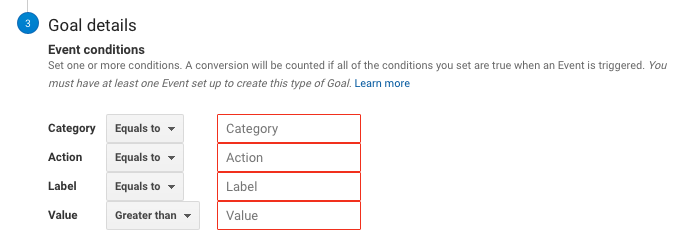
The downside of event tracking is that it has to be set up on the website. The other goal types can all be set up within Google Analytics, but a developer typically has to help set up an event, because it requires additional code to be added to the site.
Examples of event goal conversions:
- A download of a PDF or other document – this can be tracked with a click event on a link to download
- A video view – this can be tracked as a click event on a video player. Embedded video players such as YouTube also emit events that allow tracking of percent completed
- A click on a link to another website
- Submitting a form
- Scrolling
Phone Calls
This is not a standard goal type, but worth mentioning, because it is very useful for many businesses. There are a number of 3rd party vendors that offer call tracking solutions that integrate with Google Analytics. These solutions typically provide a block of JavaScript code that dynamically swaps out phone numbers on a website with forwarding phone numbers that associate calls with website visits and sources.
What Makes a Good Goal?
There are no default goals in Google Analytics, and no standard best practice for what should count as a goal and what should not.
For an ecommerce business, it’s pretty straightforward: a sale equals a conversion. For many businesses, it is more nuanced. For example, what does a car dealer count as a conversion? Car dealer websites typically have financing application forms, requests for quote forms, and a host of other ways a prospect can interact with the site. Are they all conversions? Should they all be counted equally?
The answer is that any interaction that equates to value should be counted as a conversion, and no, all conversions do not need to be counted equally.
Generally speaking, more data is better when it comes to goals. Goals are useful for understanding the value of different traffic channels, or difference in performance between locations, age groups, or other dimensions. Having more goal conversion data makes it easier to identify when one of these dimensions is performing better than another.
One of the most common problems with Google Analytics accounts is incomplete or incorrect goal tracking. A good exercise when beginning to work with a GA account is to review the site and identify any and all user interactions that relate to the business’s business. Then compare what you find to the goals set up in GA. If you find meaningful interactions that are not being tracked as goals, recommend that they be added. Also make sure to test existing goals to make sure they work as expected. It is pretty common for goals to stop working properly because changes have been made to a website, but no one has updated the goals.
Conversion Funnels
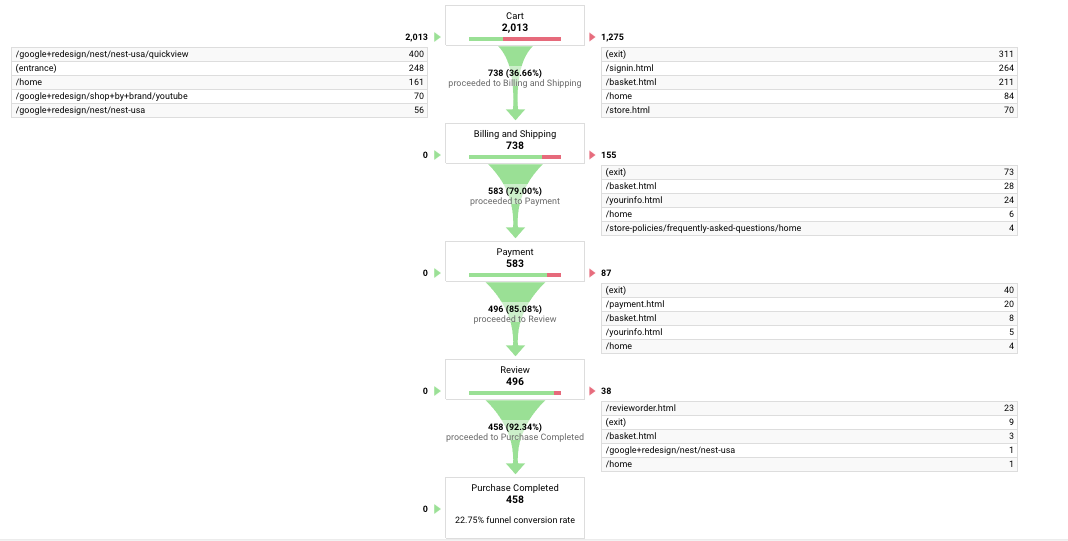
Demo: Analytics Demo Account > Conversions > Goals > Funnel Visualization
When setting up a destination (URL-triggered) goal conversion, you can specify a conversion funnel, which tracks specific steps leading up to a conversion. The most common use of this is to track shopping cart steps leading to a purchase, but any sequential process on a website can be defined as a conversion funnel.
Below is an example of a funnel, from the Google Analytics Demo account. Funnels are extremely useful for analyzing where people drop off on the way to a goal completion, and where they go. For example, if a high percentage of people are exiting from a payment page, it may be a sign that a site should offer more options for payment methods.
Multi-channel Funnel Reporting
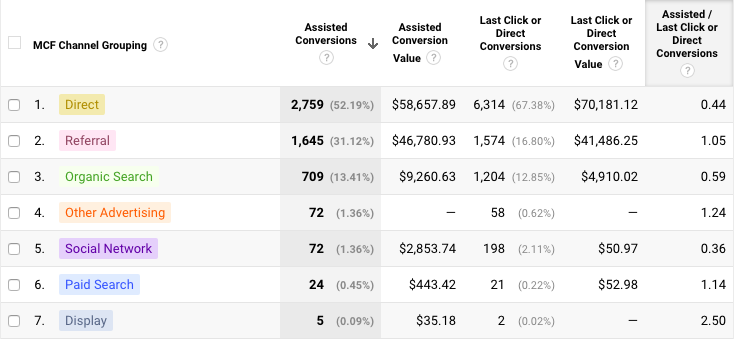
The multi-channel funnel section of GA reporting shows the behavior of visitors who leave the site, then come back before converting. This can be very useful for understanding the value of sources of traffic that contribute to conversions, but are not necessarily the last source before conversion. For example, if a person finds out about a website via Facebook, but then later returns via Google organic search and completes a goal conversion, Multi-channel funnel reporting can show you this sequence.
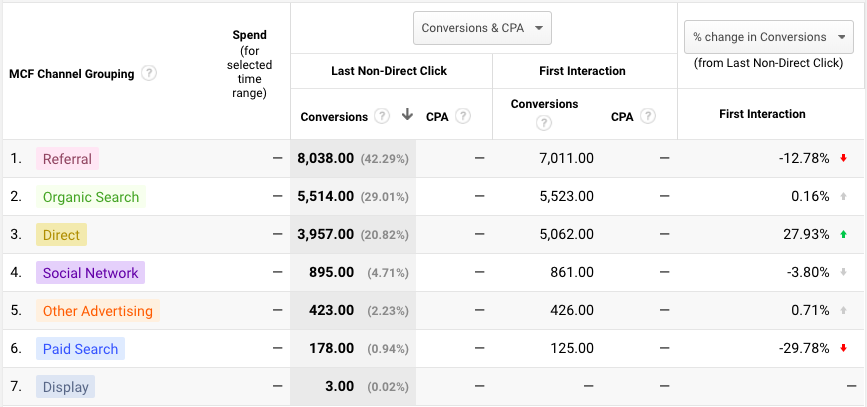
Below is the assisted conversion report. This report shows sources that influenced conversions but were not the last click before conversions. It is a quick way to see the indirect impact of different channels, but not particularly useful for ROI analysis, since it doesn’t weight assists depending on how many sources were involved. In other words, if ten sources preceded a converting visit, all 10 get credit for the same assist.
Conversions > Multi-Channel Funnels > Assisted Conversions
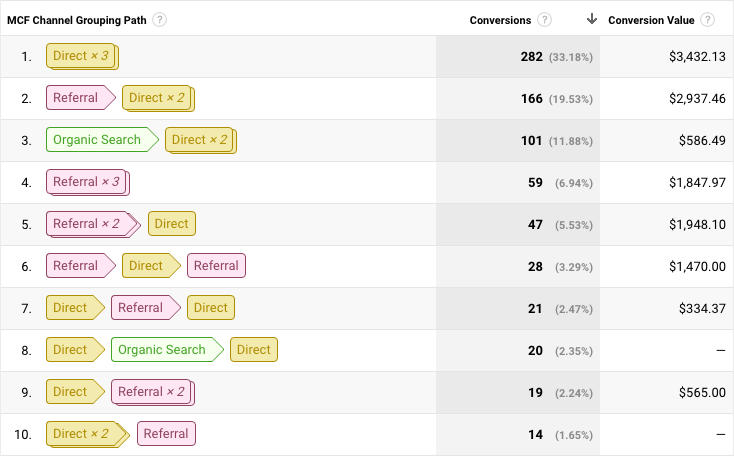
The top conversion paths report details out exactly what sources preceded converting visits and is extremely useful for understanding visit behavior and the impact of different marketing channels.
Conversions > Multi-Channel Funnels > Top Conversion Paths (Google Analytics demo account)
A few important points about multi-channel funnel reporting:
- GA can only report on return visits when it knows that the same person is coming back to the site. There are many reasons why GA may have an inaccurate or incomplete view of individual visitors – more on this below. As such, take these reports as directionally useful, but not absolute truth on repeat visit behavior.
- Elsewhere in GA, the default model for attributing conversions is last, non-direct click. In multi-channel funnel reporting, direct visits are also included. We talk about this more in the next section, but the main takeaway here is that multi-channel funnel reports often do not exactly match other reports.
Attribution Models
When Google Analytics shows a goal conversion metric attributed to a dimension such as source, medium or location, the dimension applies to the last time the user visited the site before completing the goal conversion. For example, if you visit a site on your phone from Denver, then visit it the next day from Fort Collins and fill out a contact us form that is configured as a goal, the contact us goal would be attributed to a visit from Fort Collins. This is called last click attribution, since the goal is attributed to the last click through to the site.
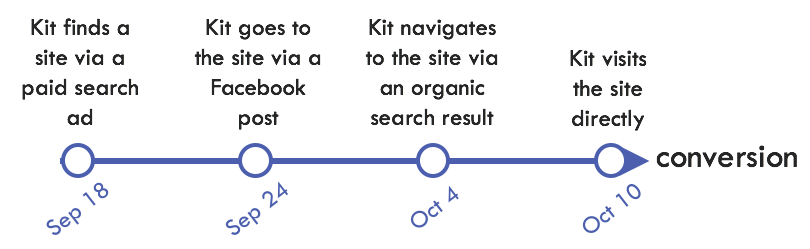
When it comes to attributing goal conversions to a source, medium or channel, the attribution model used by Google Analytics is last non-direct click. What this means is that Google Analytics will attribute a conversion to the last tracked source. For example, in the sequence of visits below, the conversion would be attributed to the second-to-last visit, which is an organic search. If a person only visits a site directly and converts, then the conversion is attributed to direct.
But shouldn’t paid search and Facebook get some credit for the conversion? Some would argue that the first source deserves more credit than the last, or that credit for the conversion should be shared between all sources. These are called “attribution models”, and Google Analytics is currently beta testing features that will allow users to change the default attribution model from last non-direct click to various other models. They have already released this functionality in AdWords.
Other Attribution Models
In addition to last click, some common attribution models are:
First-click – the first click through to a site gets all the credit
Linear – all click throughs get equal credit
Time-decay – credit is split, but the most credit is given to the most recent click through, and less is given to previous click throughs as a function of time
Given time and analysis chops, it often makes sense to develop an attribution model that is specific to a given advertiser and implement it as a custom model in GA. Here are a few factors that vary by circumstance:
- Do customers tend to repeat purchases? If so, more weight should be given to more recent clicks.
- Conversely, if most customers are purchasing for the first time, the source that drove the first click should be given more weight.
- What percentage of organic search traffic is brand? If the percentage is high, organic search should not receive much weight, since brand search traffic is navigational.
- If the advertiser invests a lot in broadcast media (print, TV, radio), direct and brand search traffic should receive more weight, since these sources are impacted by offline media exposure.
The Model Comparison Tool
Conversions > Attribution > Model Comparison Tool
The model comparison tool allows you to compare different attribution models. It is not possible to apply different attribution models to other reports in GA at present, but Google has a product in beta creatively named “Google Attribution” which should extend the attribution modeling capabilities of GA.
No Attribution Model Is (even close to) Perfect
Below is a visualization of the customer journey (source: Forrester Research). It is meant to demonstrate that people rarely conform to the funnel we marketers use to describe their behavior. This has significant implications for what we can know from GA. The reality is that most consumers have had many exposures and interactions with a business or brand before they purchase that may not be tracked in Google Analytics.
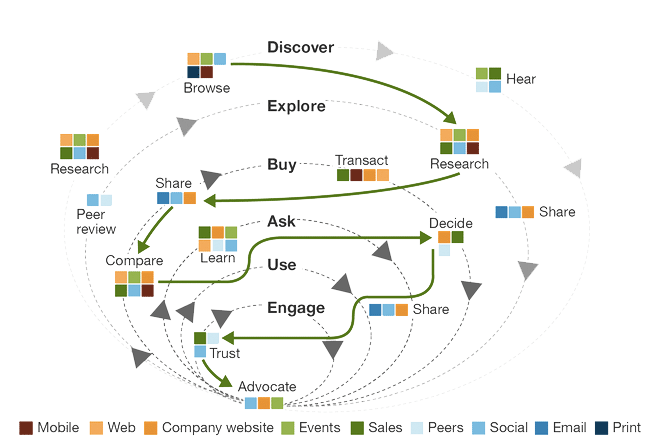
Some, like social and email may or may not, depending on whether or not the person clicks through to the website. Some behavior becomes even harder to track, because multiple people or devices are involved. Also, the consideration process for complex purchases such as education, real estate or travel may take months or even years, which increases the probability of untracked interactions. Below are some of the factors that can cause GA data to be erroneous or incomplete.
- Multiple people involved in a purchase decision
- Using multiple devices during the consideration and purchase process
- Blocking or clearing cookies – Google Analytics relies on cookies to track users. Some users use cookie blockers or private browser sessions to prevent being tracked
- Offline interactions that can’t be tracked, such as TV, radio, print and in-store visits
- Online interactions that are not tracked in Google Analytics, such as research on third-party sites like Yelp and TripAdvisor, or social media networks
Industry research, focus groups, regression testing and other statistical methods can help quantify the untracked impact of marketing channels, to help quantify the full impact of marketing. Some advertisers also heuristically lower their ROI goals for tracked results, because they know that the impact of marketing is generally greater than what can be tracked. But it is more common for an advertiser to focus on what can be measured and ignore the factors discussed above.
People in the industry often talk as if we are getting closer to perfect knowledge of the customer journey, but in many respects, we are actually getting farther away. Facebook, Google and many other services are making it easier to find out about a business without going to the business’s website, and browsing behavior is spread across more and more devices. Increased focus on privacy is also making it harder for user behavior to be stored and shared from one site or service to another. If we reconcile ourselves to the fact that we have at best partial knowledge of users over time, we can use GA to form a more accurate picture, even if it is a bit blurry in places. This brings to mind the inimitable words of Donald Rumsfeld:
“There are known knowns. These are things we know that we know. There are known unknowns. That is to say, there are things that we know we don’t know. But there are also unknown unknowns. There are things we don’t know we don’t know.”
In the world of Google Analytics, the known knowns are things like what pages get viewed, and how many people complete a lead form. Known unknowns include the “whys” behind visitor behavior, and personal characteristics of visitors. Unknown unknowns are by definition unknowable, but certainly include nearly everything a website visitor does before and after a visit.
Offline/Offsite Conversions
If you are a brand marketer, some or all sales may happen somewhere other than your website, and cannot be tracked directly in Google Analytics. If you are not taking this revenue into account, you are significantly undervaluing the impact of marketing. Following are a few tactics for estimating the impact of your digital marketing on sales that happen elsewhere.
- Store locator searches. Research published by Google indicates that “76% of people who search for something on their smartphones visit a business within a day[5].” Use your judgement on how to value this, but here’s a way to think about it: if 76% of people who search for a store visit a store, and they are looking for your product specifically, they are very likely to purchase. If we estimate that 2/3rds of those people purchase, that means that about 50% of store locator searches result in a purchase.
- Clicks from your site to online retailers. See if you can add a UTM code to offsite links, and get reporting back from retail partners on purchases attributed to you. They also may have an existing affiliate program you can use to track performance, even if they are not paying you as an affiliate. If you send traffic to Amazon and you also Advertise on Amazon, a reasonable estimate is that traffic you send converts similar to a person who does a brand search on Amazon. You can estimate the likelihood of brand searches converting on Amazon using the Search Term report and the Purchased Product report.
- A/B testing. Perhaps the best way to measure the total impact of your digital marketing is to A/B test in geographic markets. To do this, set up a control group of 5 or 10 markets, where you will not advertise, and then run digital in 5 or 10 markets and compare total sales between the test group and the control.
Conversions: Answering Questions with Data
Below are some of the business questions that conversion reporting can answer.
Question: are the top conversion paths varied and complex? Do they represent a significant percentage of conversions?
- Report: Conversions > Multi-channel Funnels > Top Conversion Paths
- Business insight: this is evidence that customers tend to visit multiple times and through multiple channels before converting, which supports a cross-channel approach to marketing.
Question: how does Source / Medium performance for Last Interaction versus First Interaction attribution?
- Report: Conversions > Attribution > Model Comparison Tool
- Business insight: sources that do better in the First Interaction model are not getting enough credit, since GA defaults to Last Interaction attribution.
Question: are there traffic sources that influence conversions, but don’t get attribution?
- Report: Conversions > Multi-channel Funnels > Assisted Conversions
- Business insight: these sources may be undervalued and deserve more focus.