Slide 2. https://www.localseoguide.com/seo-the-lsg-way-earn-your-knowledge/ was an article by my friend Dan Leibson that got me excited to embark on this journey of discovery.
Slide 3. Explorer is a tool we’ve built for exploring GSC data at scale.
Slide 8. https://blog.marketmuse.com/the-difference-between-keywords-and-topics/
Slide 30. https://developers.google.com/knowledge-graph/reference/rest/v1
Slide 31. https://docs.google.com/spreadsheets/d/1Kbf78c6v_5eBfiiIBRYdaj30CvwtFyHPS06k2hizWnY/edit?usp=sharing
Slide 36. https://chrome.google.com/webstore/detail/linkclump/lfpjkncokllnfokkgpkobnkbkmelfefj
Slide 79. https://docs.google.com/document/d/1KDhhMXZH8NBV8UWH3vVC5RRE5dcrpvu4iEYCKsthlxY/edit?usp=sharing is a step by step workflow for getting Keyword Planner data into a usable format.
Slide 45. Difference between Autosuggest and Google Trends from Google’s own documentation.
Slide 47. Google Trends is a killer resource for seeing Search data over time.
Slide 54. DataForSEO – Google Trends API, pytrends, and Node.js Google Trends API are three popular ways to work with Google Trends data.
Slide 70-75. ObservableHQ. I experimented heavily with this platform and think it’s a great tool to use to build different visualizations of your data. Each of the different visualizations mentioned gives a different way to see the data. Pick what works for you!
Onboarding Questions to ask
- What services do you offer?
- What is most profitable?
- What is a conversion worth?
- When do you make your money?
- Where do you make your money?
- What is your sales process?
- What questions from potential customers drive decision?
- How can content support the sales process?
Wikipedia Workflow
- Go to Wikipedia and search for the service.
- Link clump Chrome Extension
- Grab anchor link text.
- paste results to our sheet.
Noah’s Google Trends Sunburst Output
Play with this tool. I think you’ll find it’s a total hoot. Use it to see relationships.
Don’t use it to see parent / child relationships.
The Knowledgegraph tool
https://docs.google.com/spreadsheets/d/1Kbf78c6v_5eBfiiIBRYdaj30CvwtFyHPS06k2hizWnY/edit?usp=sharing
Lee Foot’s Colab Workflow
- Edit the output CSV name
- Click Runtime > Run All
- Upload your CSV when prompted
- Your CSV will Download into your machine
Content Gaps Workflow (using Count)
I experimented heavily with Count and found it to be super useful and easy to use for folks who have even the smallest amount of SQL knowledge.
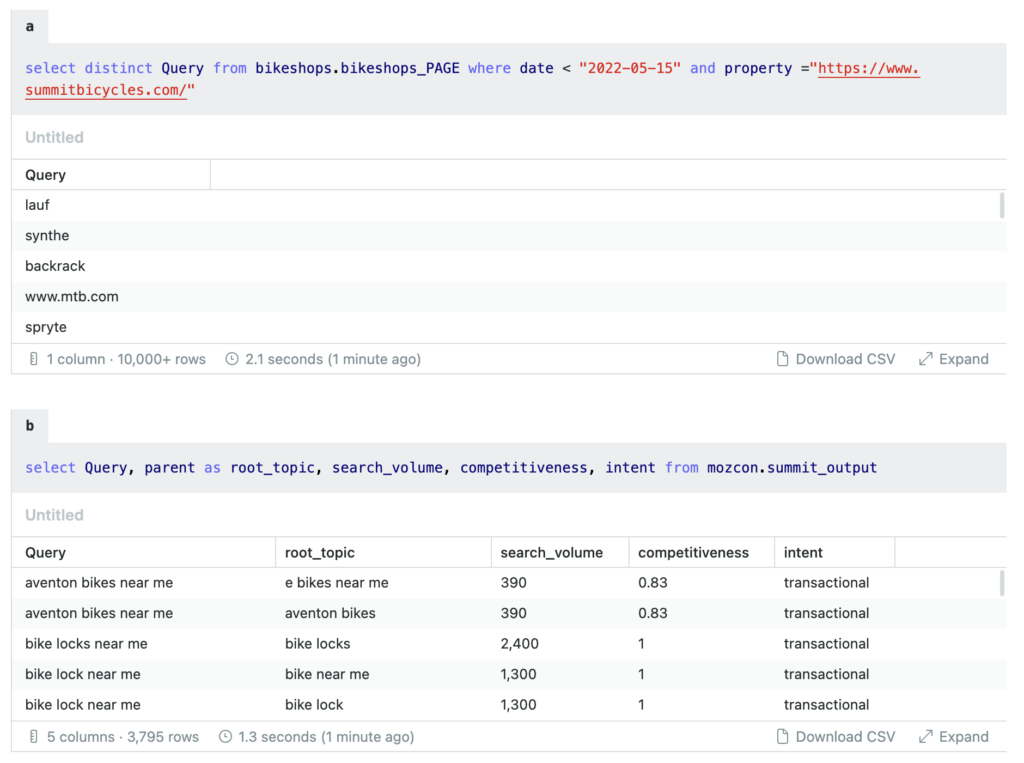
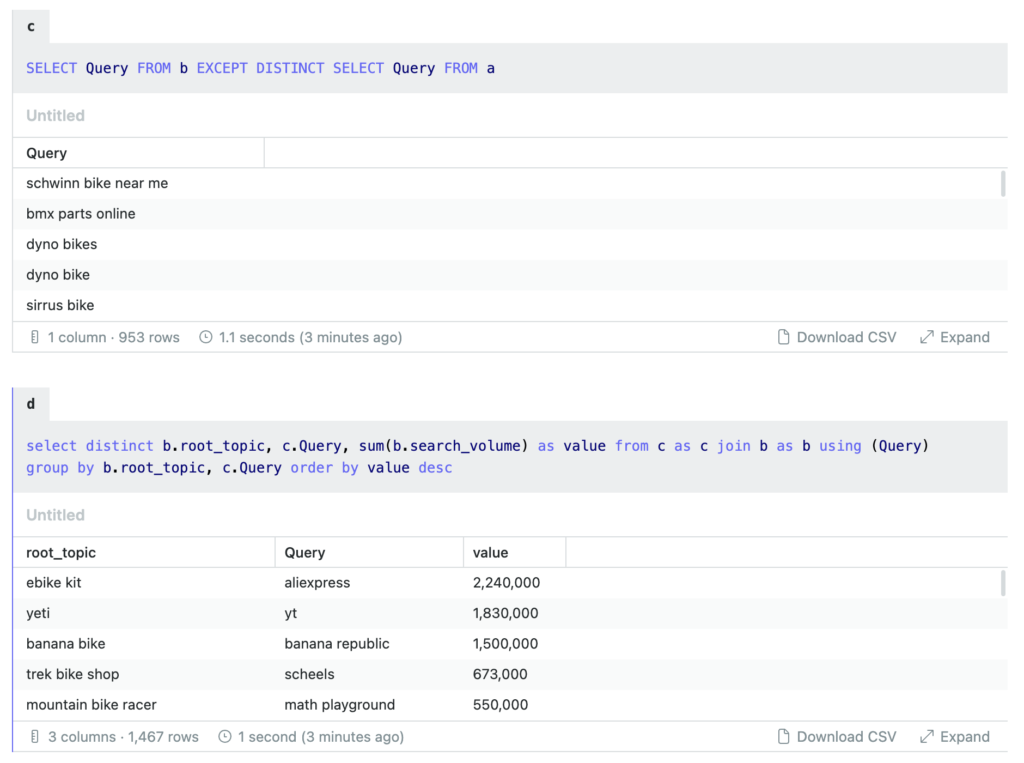
Joining our “Gap” data back up with its enriched data gives us great visibility into how useful it would be to write about a specific topic.
Photo Credits