GA4’s standard Monetization reporting section isn’t perfect. There are several default reports that most organizations just don’t need. And the main purchases report shows activity by item, which isn’t really that meaningful if you sell dozens and dozens of products. I’d much rather see ecommerce metrics based on where traffic is coming from.
In this video and the blog below, we’ll modify the Monetization reports menu, change the Ecommerce purchases report, learn about item-scoped and event-scoped dimensions and metrics, and create a new ecommerce report based on traffic source and make it available in the Monetization menu.
Simplify the Monetization reports section in GA4
The first thing we’re going to do is get rid of a few reports in this Monetization section.
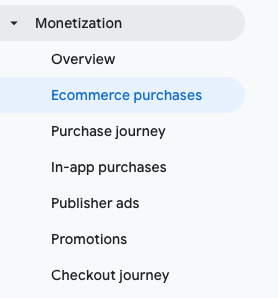
Really, most of the time, these two reports are not necessary:
- In-app purchases. Relevant if you have a mobile app and it’s set up to track in GA4 and people can purchase things in the app.
- Publisher ads. Tracks Google Ads Manager data if you’re running ads on your website or mobile app.
Let’s remove these two reports from the menu.
- Go to the Library at the bottom of the Reports menu. (You need to have at least Edit access to GA4 to see the Library.)
- Edit the Lifecycle collection.
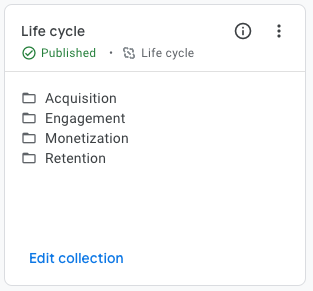
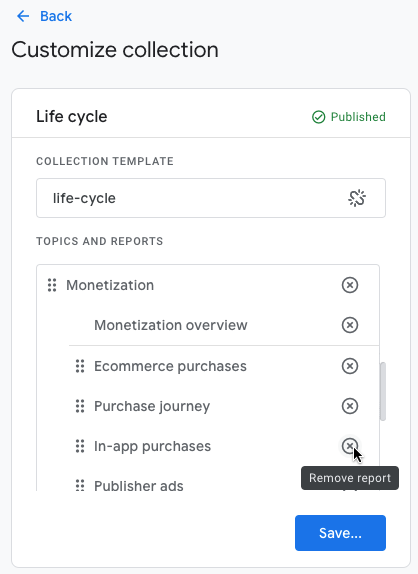
Note that the reports menus can be customized, so your Life cycle collection or Monetization menu might look different. - Scroll down to the monetization section, and delete In-app purchases and Publisher ads, then Save changes to current collection.
Modifying the Ecommerce purchases report
I don’t really like this as the main Ecommerce report, because when you sell lots of items, the data just gets really diluted and not very meaningful. It’s worth keeping around, but let’s make a few changes to it.
First, the graphs at the top aren’t very helpful. The graphs at the top of a default GA4 report show the top five dimensions in that report. And that can be useful for something like default channel grouping where you don’t have that many default channels. For a report of products sold, or something like landing pages, you’ll typically have lots more than five things to show, so the graphs aren’t really useful at all.
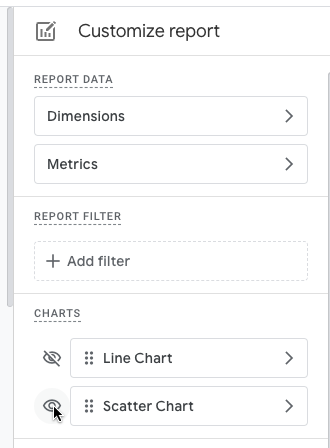
So let’s edit this report to hide these two charts.
- View the Ecommerce purchase report from the Monetization menu. Click the pencil icon in the upper right of the report to edit it.
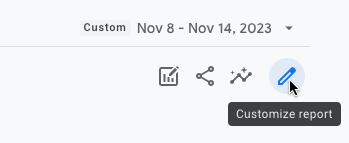
- Click the eye to hide those charts.
- Save the changes.
You’ll see that when you save changes to a report, GA4 often will append to the report’s name the dimension used in the report, so now it’s called “Ecommerce purchases: Item name”

Go back to the Library, find the saved report in the list of Reports and change the name to something like “Item purchases”.
Item-scoped vs. Event-scoped metrics in GA4
The default Ecommerce purchases report shows ecommerce metrics for each item. That’s called an item-scoped report. There’s another kind of ecommerce metric in GA4, event-scoped metrics. Event-scoped metrics show overall the number of add to carts, purchases, checkout events.
I find the topic of dimension and metric compatibility pretty confusing GA4. If you’ve tried dragging different metrics into reports and explorations, you’ve likely run into a situation where options get grayed out or disappear as you try to add different dimensions and metrics to your workspace. This is because the metrics aren’t compatible with each other and so they can’t be used in the same report. For example, if you’re building an exploration and you add the Item name dimension as a row, metrics like Checkouts and Ecommerce purchases can’t be added to the table. You can see me walk through this in an Exploration in GA4 in the video at 5:00. (You’ll also see one thing I love Explorations for: applying proper segments to data the way we could in Universal Analytics.)
The GA4 Dimensions & Metrics Explorer is a helpful tool for exploring what dimensions and metrics can be used with each other. Once you select a dimension, like Item name, it will display compatible dimensions and metrics that I can choose from. It’s also a great tool for seeing all the various dimensions and metrics available in GA4.
Create a better ecommerce report
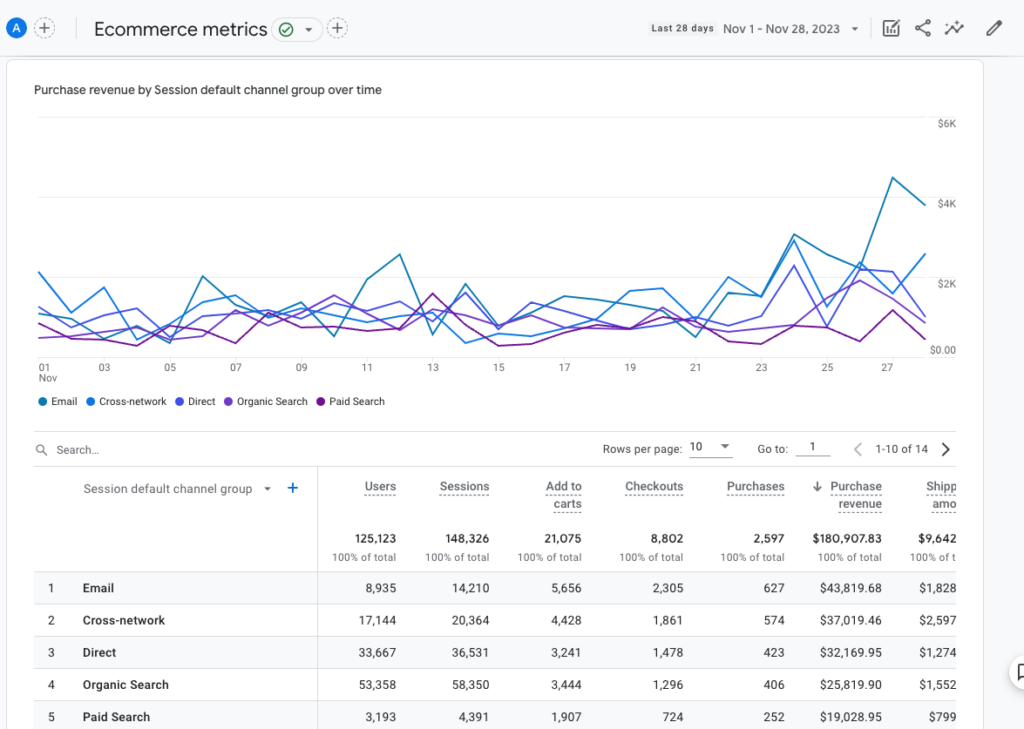
A more useful ecommerce report, I think, would show more of a summary view of ecommerce metrics like Adds to cart and purchases. I’d like to see that information split out by traffic source. Here’s the report we’re going to create:
Let’s start by creating a new report.
- Go to the Library at the bottom of the Reports menu.
- Click Create new report and select Create detail report.
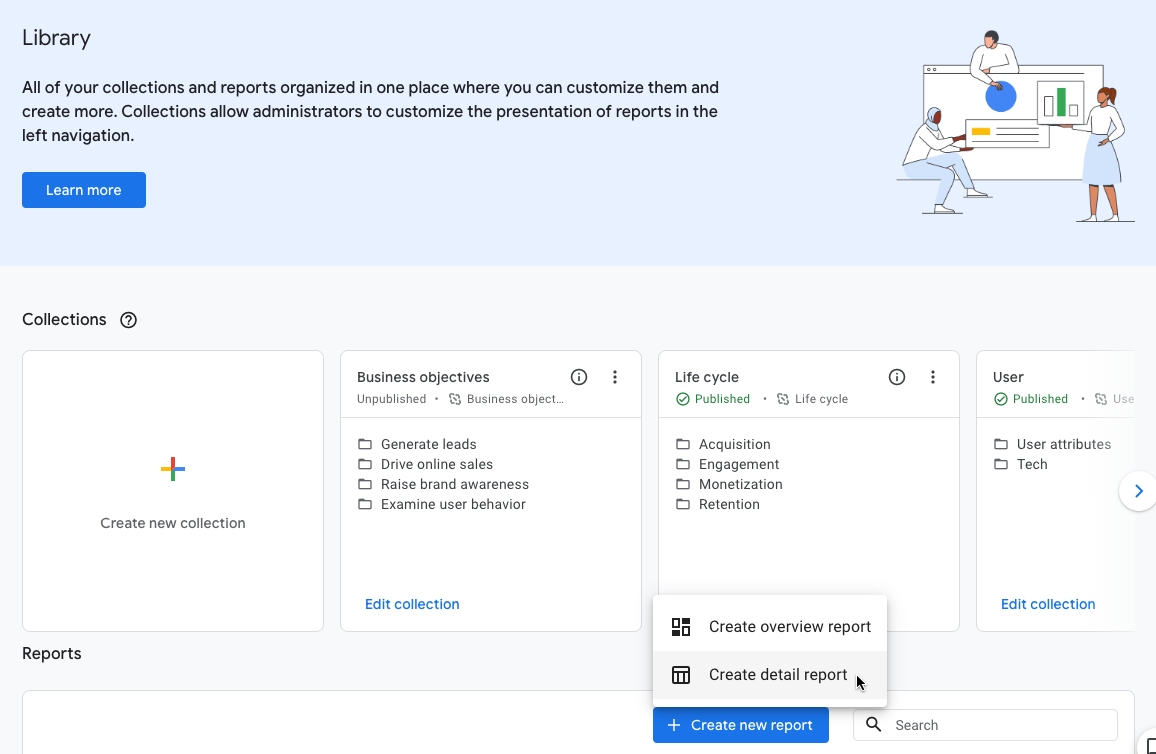
You might be tempted, like I was, to start with a blank report, look for ecommerce metrics, and grab ones like Add to Cart, Checkout, ecommerce purchases, etc. But if you do, you’ll see that there are almost no dimensions you can add to the report. Instead, you’re better off starting with a Traffic acquisition report.
- Under Start from a template, select either User acquisition or Traffic acquisition template. (User acquisition gives you the source where a user came from on their first visit to a website, whereas traffic acquisition is session based, so what source they came from for a given session.)
- Under Customize report on the right, click on Metrics. Get rid of most of these metrics, leaving Users, Sessions, and Engaged sessions, and add Add to carts, Checkouts, Ecommerce purchases, Ecommerce quantity, and Purchase revenue. Click Apply.
Now, we have traffic by source on the left, and all these ecommerce-related metrics next to each source. The graphs up top are more useful because they show the highest-volume traffic sources. Personally, I don’t find the bar chart that interesting, so I’d get rid of that by clicking the eye next to “Bar Chart” in the Customize report area.
- Save this report as “Ecommerce metrics”
- Go to the Library. Edit the Monetization collection and drag your new report on the right over into the Monetization group on the left.
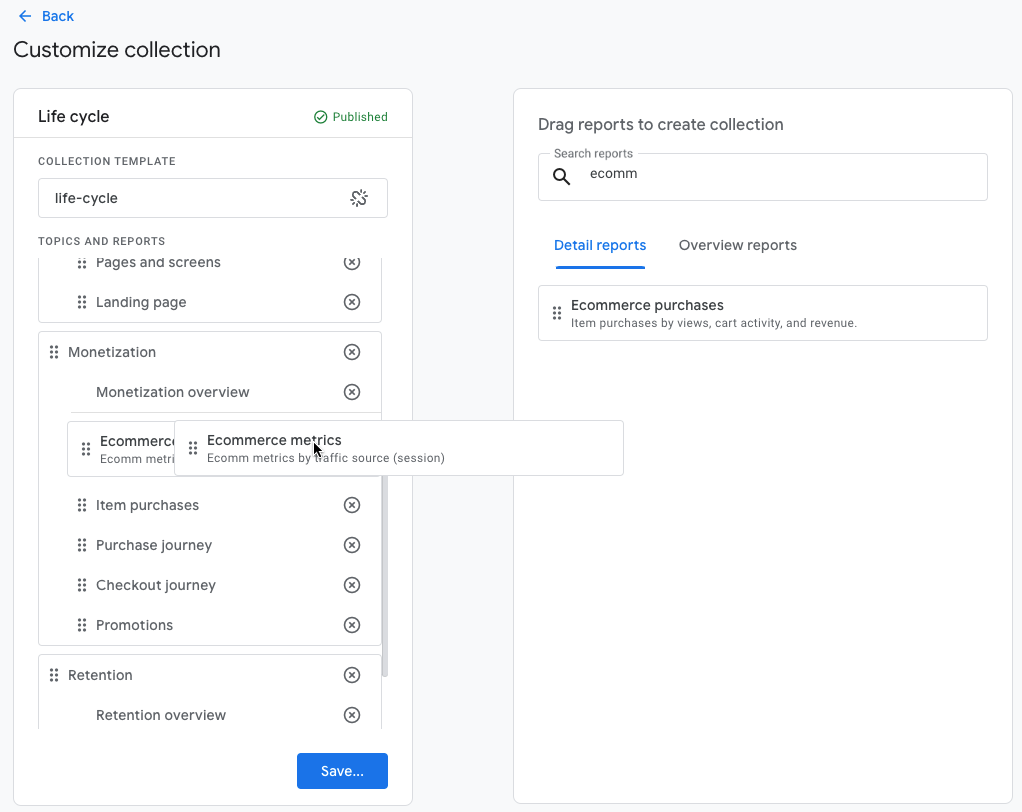
Save.
And now we have in our regular navigation the swanky Ecommerce metrics report we just created. I really like being able to see detailed ecommerce metrics such as the cart, checkouts, and purchases. Unfortunately, I haven’t figured out a way to show an ecommerce conversion rate–yet.

Check out more of our GA4 Tutorials.
We love GA4 so much, we work on it all day long. If you’re in need of assistance, take look at our service offerings:
- Training and coaching that is very much customized to each organization’s needs, a lot different than the standard GA4 training you’ll find on the internet.
- GA4 setups and audits that make sure your tracking is set up right.
- Marketing dashboards so the entire marketing team is on the same page.