In April of this year, I published research measuring search demand for several aspects of the bicycle industry in order to show our bike shop clients what they might be able to expect in 2023. In that report I measured search trends for bikes, bike shops, and brands, and came away with some predictions for the 2023 season that we can now review and compare to how demand actually shaped up.
In 2023 we saw pandemic-induced challenges shift from not having enough inventory for the all-time high levels of demand to the complete opposite problem. Production more than caught up, demand dwindled, and dealers found themselves swimming in inventory that wouldn’t move. To make matters worse, many manufacturers discounted their bikes for months on end which made it even harder for retailers to turn a profit.
We’ve all been waiting for things to get back to normal in the bike industry, but unfortunately the spring and summer of 2023 wasn’t the shift we hoped for. Let’s dive into the summer review report and explore the data.
The Approach
In keeping with one of our mantras here at Two Octobers, before I began my research I started by asking questions. Here’s what I set out to answer:
- How did bike industry search demand for the 2023 spring and summer seasons compare to 2022?
- How do those initial search demand predictions from our April Bicycle Industry Revenue Forecast stack up compared to full spring and summer data?
The Report
Section 1: How did this year compare to 2022?
The first step was to evaluate how this year stacked up against the year prior and our previous predictions. To do this I measured search interest for various topics from the beginning of spring to the end of summer with Google Trends. I’ll also include the figures of two previous predictions: the first, published in our April report, was based on six weeks of early spring data; the second, shared at the NBDA Retailer Summit in May, was based on an additional four weeks of spring data.
1. Bike (topic)
To get the biggest picture possible, I examined bikes as an overarching topic, which includes any search that Google deems related to bikes. Here’s a screenshot from that report that includes data from the past 5 years.
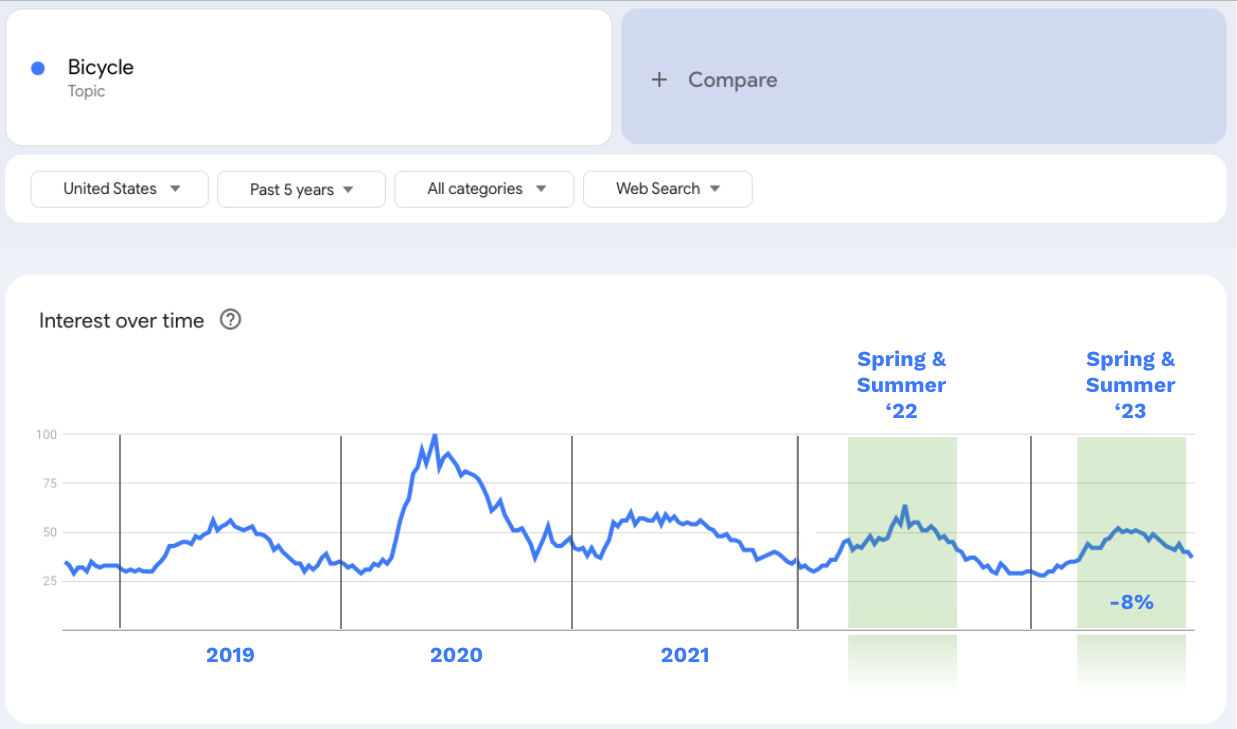
This is the general shape of most bike-industry searches since the last truly “normal” year in 2019. If you didn’t check out our last bike industry update or have never used Google Trends, you’ll note the massive spike in interest in the spring of 2020. Many topics of interest to the bike industry more or less mirror this trend line.
I averaged the interest levels from the beginning of spring to the end of summer for both 2022 and 2023, finding that the entire topic of bikes was down 8%. That’s actually a bit better than the data suggested when we published our previous report in April, but still not what we’d hoped.
2. Bike Shop (topic)
Next, I pulled the numbers for all searches that Google deemed related to the topic of bike shops.
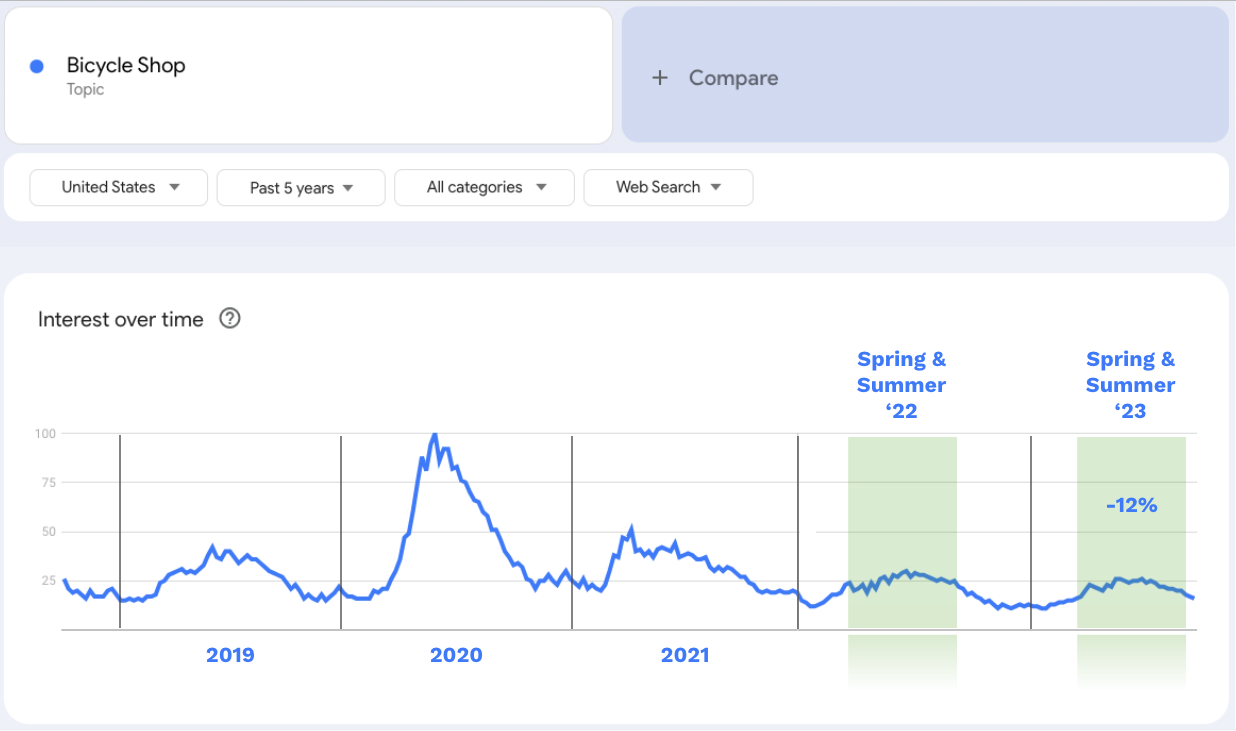
As we saw in our last report, searches related to bike shops dropped a bit more than for bikes as a whole. Bike shop searches were down 12% from 2022.
3. Bike Types (topics)
Next up to be analyzed are some of the most popular bicycle categories. You’ll notice that two categories, mountain bikes and electric bikes, are by far the most popular. This also means that the categories that have the least amount of search interest by comparison look compressed to the point that it’s hard to tell how they are trending individually. I’ll include the graphs that show the categories compared against each other as well as the data I got from viewing each one on its own.
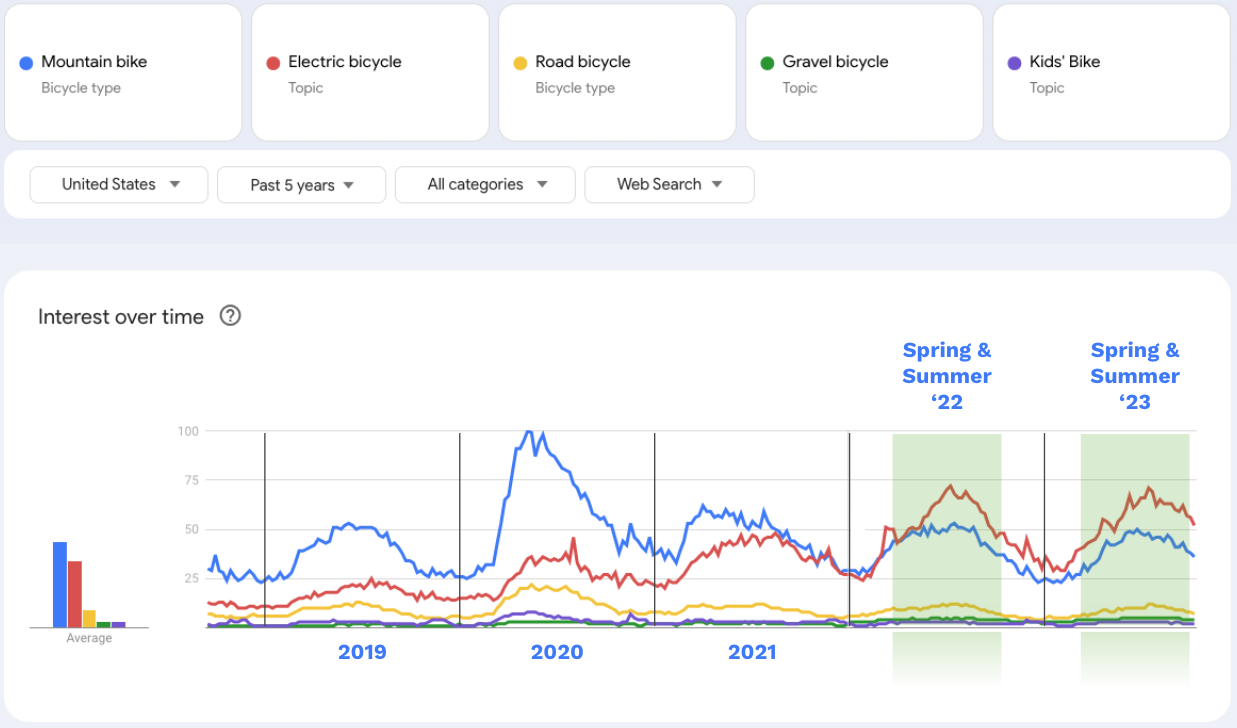
We can see that electric bikes overtook mountain bikes as the most searched for category last year, and that trajectory doesn’t appear to be changing. We can only compare 5 topics at a time in Google Trends, but I pulled the numbers for hybrids and cruisers as well. Here are all the bike types I examined along with what the data suggested in the spring:
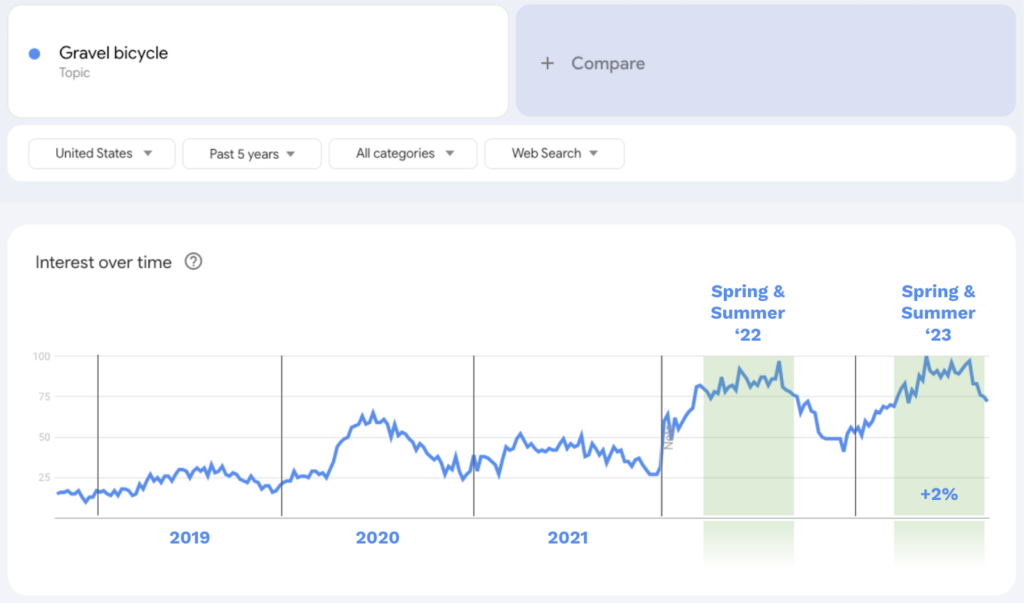
Electric, gravel, and kids’ bikes all saw slightly positive YoY growth in search interest, although the gains were small. We’ve been able to clearly see the trend line for ebikes, but let’s take a look at gravel bikes on it’s own since those lines are compressed in the previous chart.
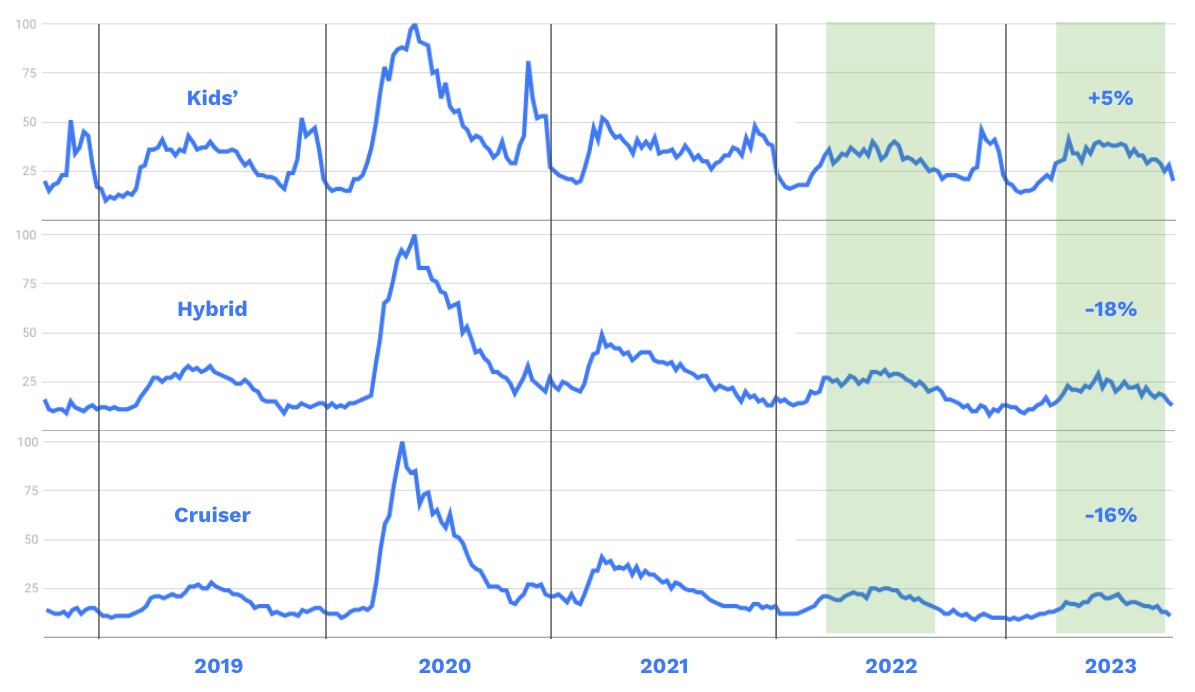
And let’s not forget to look at kids’, hybrids, and cruisers. We see the holiday season spike for kids’ bikes, but the general curve looks similar to most other categories.
Recapping the Bike Search Trends Summer Review
To summarize the findings, let’s review the questions I set out to answer and answer them as best we can with the data we have.
How did bike industry search demand for the 2023 spring and summer seasons compare to 2022?
When comparing this year’s spring and summer to last year’s:
- the sum of all bike related searches was down 8%
- searches for bike shops were down 12%
- electric (+1%), gravel (+2%), and kids’ bikes (+5%) saw marginal improvements in demand
- all other measured bike categories saw declines in search demand of 8-18%
How did our previous predictions match up to the actual search demand changes we saw this year?
The good news is that the actual 2023 search demand turned out to be significantly better than the data suggested in our April predictions, and somewhat better than our May predictions. Our predictions were based on year-over-year seasonal trends–that is, whether search volume was on-pace with previous years. What seems to have happened is that during the early 2023 season bike-related interest was below pace, but in several topics interest caught up a bit more later in the season.
Unfortunately, most topics we measured still lagged behind 2022, a fact supported by the sales numbers that several of our bike shop clients have reported to us. Many of our bike retailer clients reported a slow start to the season in terms of sales, but some months (especially July) were solid. Many also reported that ebike sales have continued to be strong and are even outselling last year in some cases.
Electric and gravel bikes have continued to grow in popularity, so retailers should consider keeping those categories appropriately stocked.
Fall and Winter Search Demand Predictions
If you found value in these search demand predictions and measurements, check out our latest post regarding what bike retailers might be able to expect this fall and winter. We gather info to answer the following:
- How much does search demand typically drop in the shoulder seasons and off seasons?
- How is demand tracking for categories that are typically important for Q4 and Q1 revenue?
- What categories have continued to increase in demand since the initial bike boom?
- Which bike brands are improving in search popularity?
- What might demand be like this fall and winter?
Thanks for reading!