2023 Bicycle Industry Revenue Forecast

The pandemic shook up industries all over the world, and an industry near and dear to our hearts went on its wildest ride to date. Bike shops that had been accustomed to the predictable yearly ebbs and flows suddenly found demand at record highs, product supply stretched to new lows, and a day-to-day routine where the only certainty was uncertainty. 

Fast forward three years from the beginning of the boom and we’re still seeing ripple effects. Over the course of our elongated return to “normal”, the industry has changed quite a bit. New players emerged onto the scene and the big manufacturers made bold moves to mixed reception. The shops that took the risk and invested in inventory and ecommerce at the onset of the pandemic, were positioned to grow revenue in massive proportions, while shops that weren’t able to do so often found themselves struggling to meet the demand that exploded almost literally overnight. 

Two Octobers works with bike shops across the US and Canada, providing digital marketing services to help them grow in-store and online revenue. And as the dust from the whirlwind of the pandemic years settles and we head into a new season, there’s a question that has repeatedly come up in our meetings with shop owners and managers:

“What in the heck is 2023 going to be like?”

A mantra at Two Octobers is, “answer questions with data,” so I dug in to see what I could find.

Join us live! Meet Brett at a walk-through of the research behind our bike industry forecast for 2023. Tuesday, May 9, 2023 at 11am MT.

Get our newsletters!

Now before I dive into my research, I want to be clear about one thing: forecasting market trends is highly nuanced with lots of contributing factors (*googles macroeconomics, immediately shuts computer*) and this report is meant to be a piece of the puzzle, not the whole picture. 

Let’s get into it.

The Approach

Using Search Demand to Interpret Consumer Interest in the Bike Industry 

Another mantra at Two Octobers is “start with a question” – these are the questions I set out to answer:

      • How does search demand across the bike industry compare this year versus last year?

      • How do search trends for different areas of the bike industry compare against each other?

      • How might the 2023 season shape up from a search demand perspective?

    With these questions in mind, here are the ways in which I went about collecting data:

        • Analyze search interest trends for bikes, bike shops, and brands using keyword and topical research tools

        • Analyze organic traffic trends for major manufacturers, big online retailers, and large brick and mortar retailers

      The Report

      Section 1: Search interest trends for bikes, bike shops, and brands

      For the first section of the report, I wanted to go as wide as possible, looking at broad topic trends that might give us insight into how searchers were looking for different things within the bike industry.

      I pulled the following reports from Google Trends. Each report is designated by either “search term” or “topic.” A search term is one individual keyword, whereas a topic groups all search terms that Google deems related to a specific theme.

      1. Bicycle: topic

      We’ll start off by examining the broadest area possible: bikes, as an entire topic. For the examples in this section I’m going to stick with US data, as CA data is similar but has less info to analyze. 

      One thing to note when looking at Google Trends data is that the values reported show “interest” relative to the highest point of interest in the selected date range.

      A screenshot from Google Trends showing interest in bicycle as a topic over time.

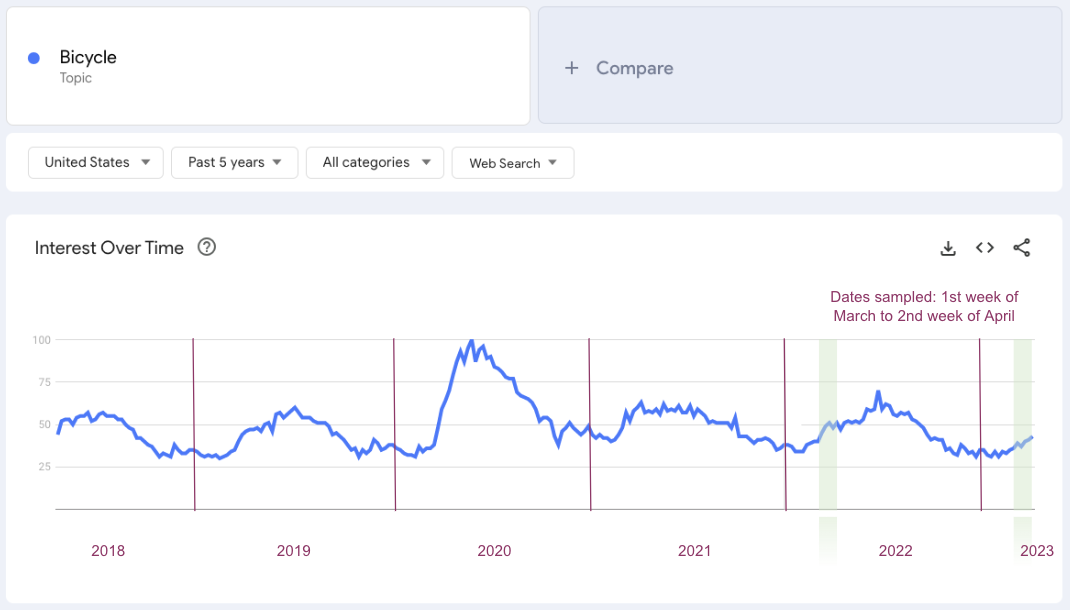
      We can see most of 2018 and 2019 ebbing and flowing in roughly similar proportion, and then BOOM. The pandemic drives search interest for bikes through the roof. 2021 was less crazy than 2020, but bigger than pre-pandemic years. 2022 continued on that same trend line, but slightly below 2021 at levels closer to pre-pandemic years. 

      This probably lines up to some degree with what bike shops have been experiencing in terms of revenue across the US and Canada the past few years.  But, “What in the heck is 2023 going to be like?” If we look at how the beginning of this year is trending compared to last year, it looks like we should expect a decline of about 15-20%. Below are the numbers week-by-week.

      Weekly search volume for bicycle (topic), 2022 vs. 2023

      WeekYOY change
      last week Feb/first week Mar-17%
      second week Mar-15%
      third week Mar-21%
      fourth week Mar-21%
      last week Mar/first week Apr-14%
      second week Apr-14%
      average change (%)-17%

      2. Bike shop: topic

      For our second topic we’ll dive in a bit deeper to examine searches related to bike shops. The idea here is to get insights into whether searches for local bike shops have tracked in parallel with the greater bicycle trends.

      A screenshot from Google Trends showing interest in bicycle shop as a topic over time.

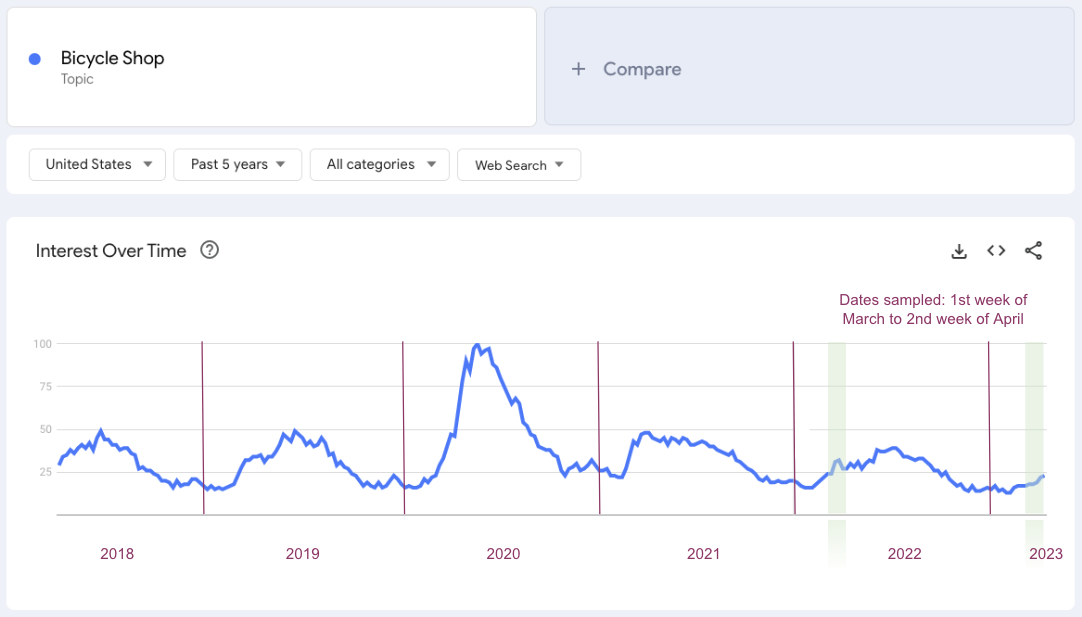
      At a glance we see a similar trend to the previous graph, but it’s already noticeable that search interest for bikes shops in 2022 was down from not only the previous year, but pre-pandemic years as well. Let’s look at the numbers:  

      Weekly search volume for bicycle shop (topic), 2022 vs. 2023
      WeekYOY change
      last week Feb/first week Mar-27%
      second week Mar-25%
      third week Mar-42%
      fourth week Mar-38%
      last week Mar/first week Apr-21%
      second week Apr-13%
      average change (%)-28%

      Instead of a 13-21% drop in search interest, searches for bike shops were down between 13% and 42% at times this year, for an average of 28% over the last 6 weeks. 

      I realize that searches like “online bike shop” could muddy the waters here but upon further inspection I didn’t find a significant number of those queries, so we can take the info above as a good representation of local bike shop search intent.

      3. Bike shop near me: search term

      Next, we go even more specific, shifting away from topics to an exact search term: bike shop near me. 

      I chose this keyword because my research indicated that “bike shop near me” is the most searched for query with the words “bike shop” in it, and also is indicative of local search intent.

      A screenshot from Google Trends showing interest in bicycle shop near me as a keyword over time.

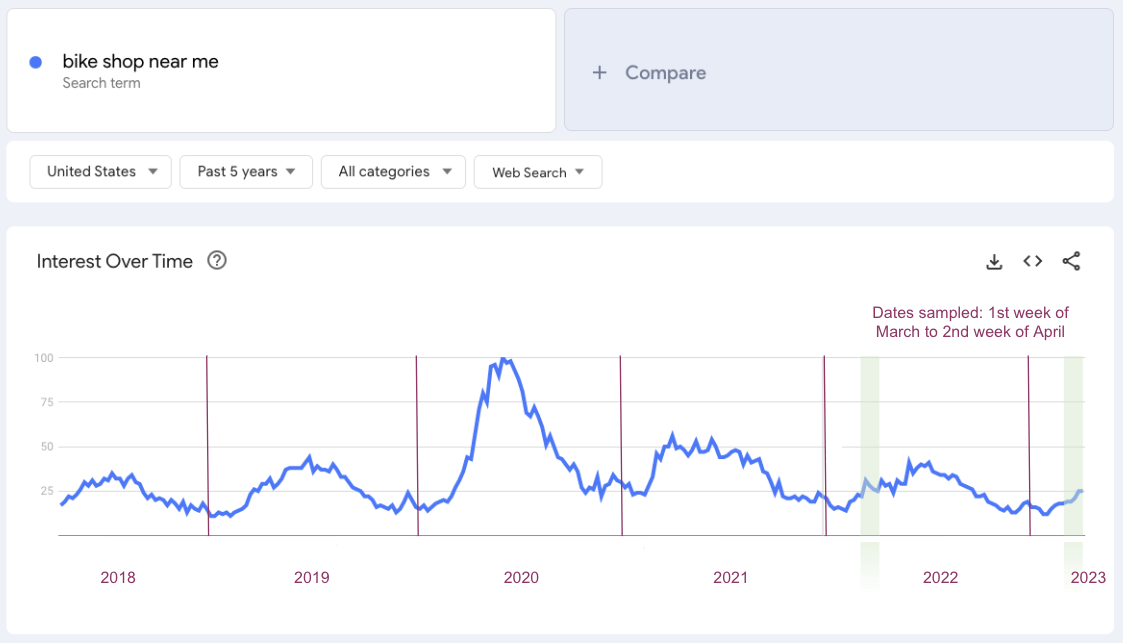
      This chart reflects a similar trend to the chart above, and appears to indicate that searches for local bike shops in 2022 were fewer than in 2021. Let see how 2023 is shaping up with last year:

      Weekly search volume for bike shop near me (keyword), 2022 vs. 2023 
      WeekYOY change
      last week Feb/first week Mar-21%
      second week Mar-12%
      third week Mar-39%
      fourth week Mar-25%
      last week Mar/first week Apr-3%
      second week Apr-3%
      average change (%)-17%

      The data here varies quite a bit, but search interest for “bike shop near me” is still down overall from 2022 with an average YoY decrease of 17% over the past 6 weeks. Although, the past couple weeks have seemed slightly more promising. One thing to keep in mind here is that this is just one specific query, so the data for other queries related to bike shops likely don’t perform as favorably (as the info from the previous section suggests).

      4. Bike types: topics

      Next, we take a look at bike types. Each of these is classified as a topic in Google Trends, so while their topic description varies, based on the data I’ve deemed them to be the same type of comparison. There are a few interesting trends to watch evolve over time.

      A screenshot from Google Trends showing interest in bicycle types as topics over time.

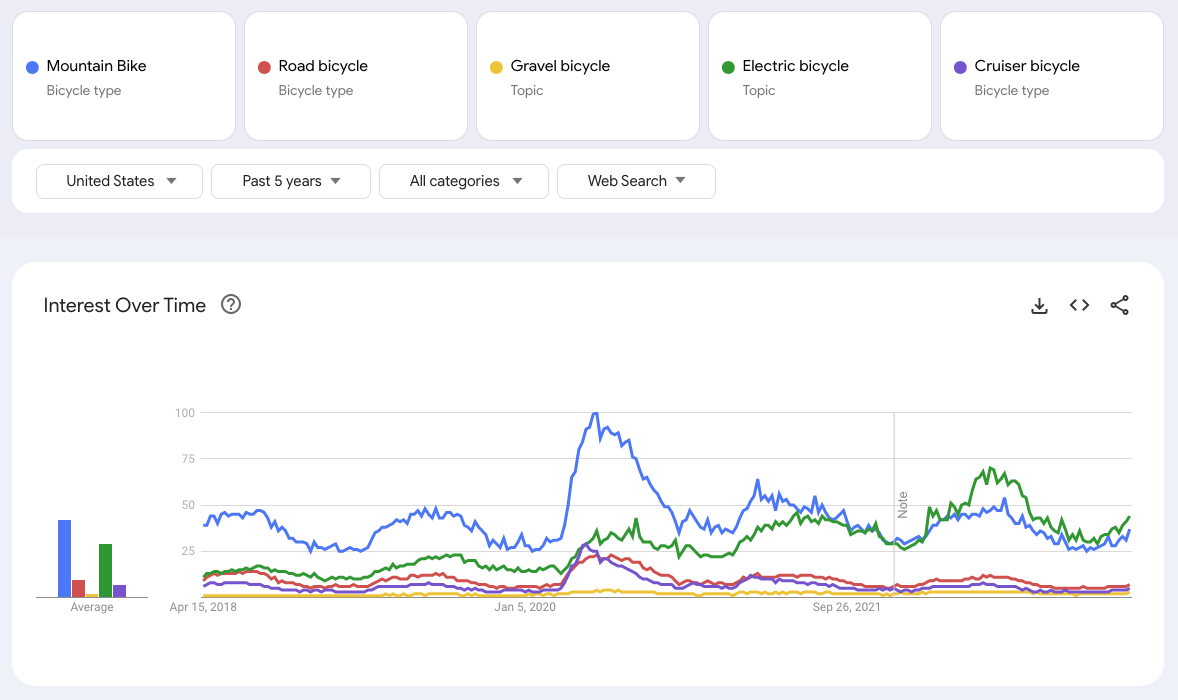
      We can see the rise of electric bikes eventually pass mountain bikes for the top spot at the end of 2021. Hybrid bikes was an available topic to choose, but it had less interest than the categories above so I left it out of the comparison. 

      A screenshot from Google Trends showing interest in gravel bikes as a topic over time.

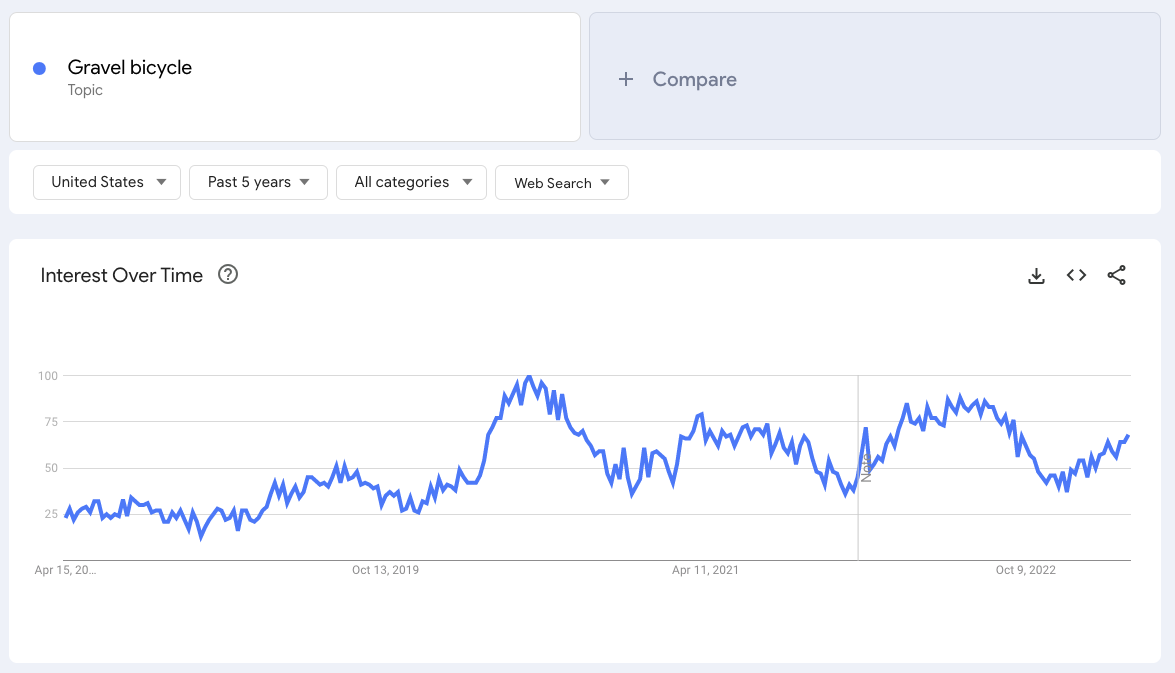
      I was a bit surprised to see Gravel lagging behind in the bottom spot. While the trends look to be accurate in terms of search volume, I did a separate analysis for gravel bikes as a topic to better understand the yearly change, since the gravel bike data gets slightly compressed in the first chart when compared to the more popular categories.

      Weekly search volume for types of bikes (topic), 2022 vs. 2023 
      WeekYOY change
      Mountain bikeRoad bikeGravel bikeElectric bikeCruiser bike
      last week Feb/first week Mar-13%-27%3%6%-30%
      second week Mar-22%-25%-18%-25%-38%
      third week Mar-20%-31%-26%-20%-44%
      fourth week Mar-16%-36%-25%-8%-39%
      last week Mar/first week Apr-26%-25%-14%0%-25%
      second week Apr-14%-17%-5%15%-25%
      average change (%)-19%-27%-14%-5%-33%

      The big takeaway for me here is that electric is the most resilient category right now and search interest for ebikes is much more similar to peak pandemic levels than other categories. 

      Mountain bike search interest is still high compared to the rest. And while gravel bikes showed strong growth over the last four years, their popularity might be leveling off. 

      5. Bike brands: topics

      Finally, let’s get into brands. I looked at Trek, Specialized, Giant, and Cannondale. Each of these is classified as a topic in Google Trends, so again their topic description varies, but based on the data I’ve deemed them to be the same type of comparison.

      A screenshot from Google Trends showing interest in bike brands Trek, Specialized, Giant, and Coannondale as topics over time.

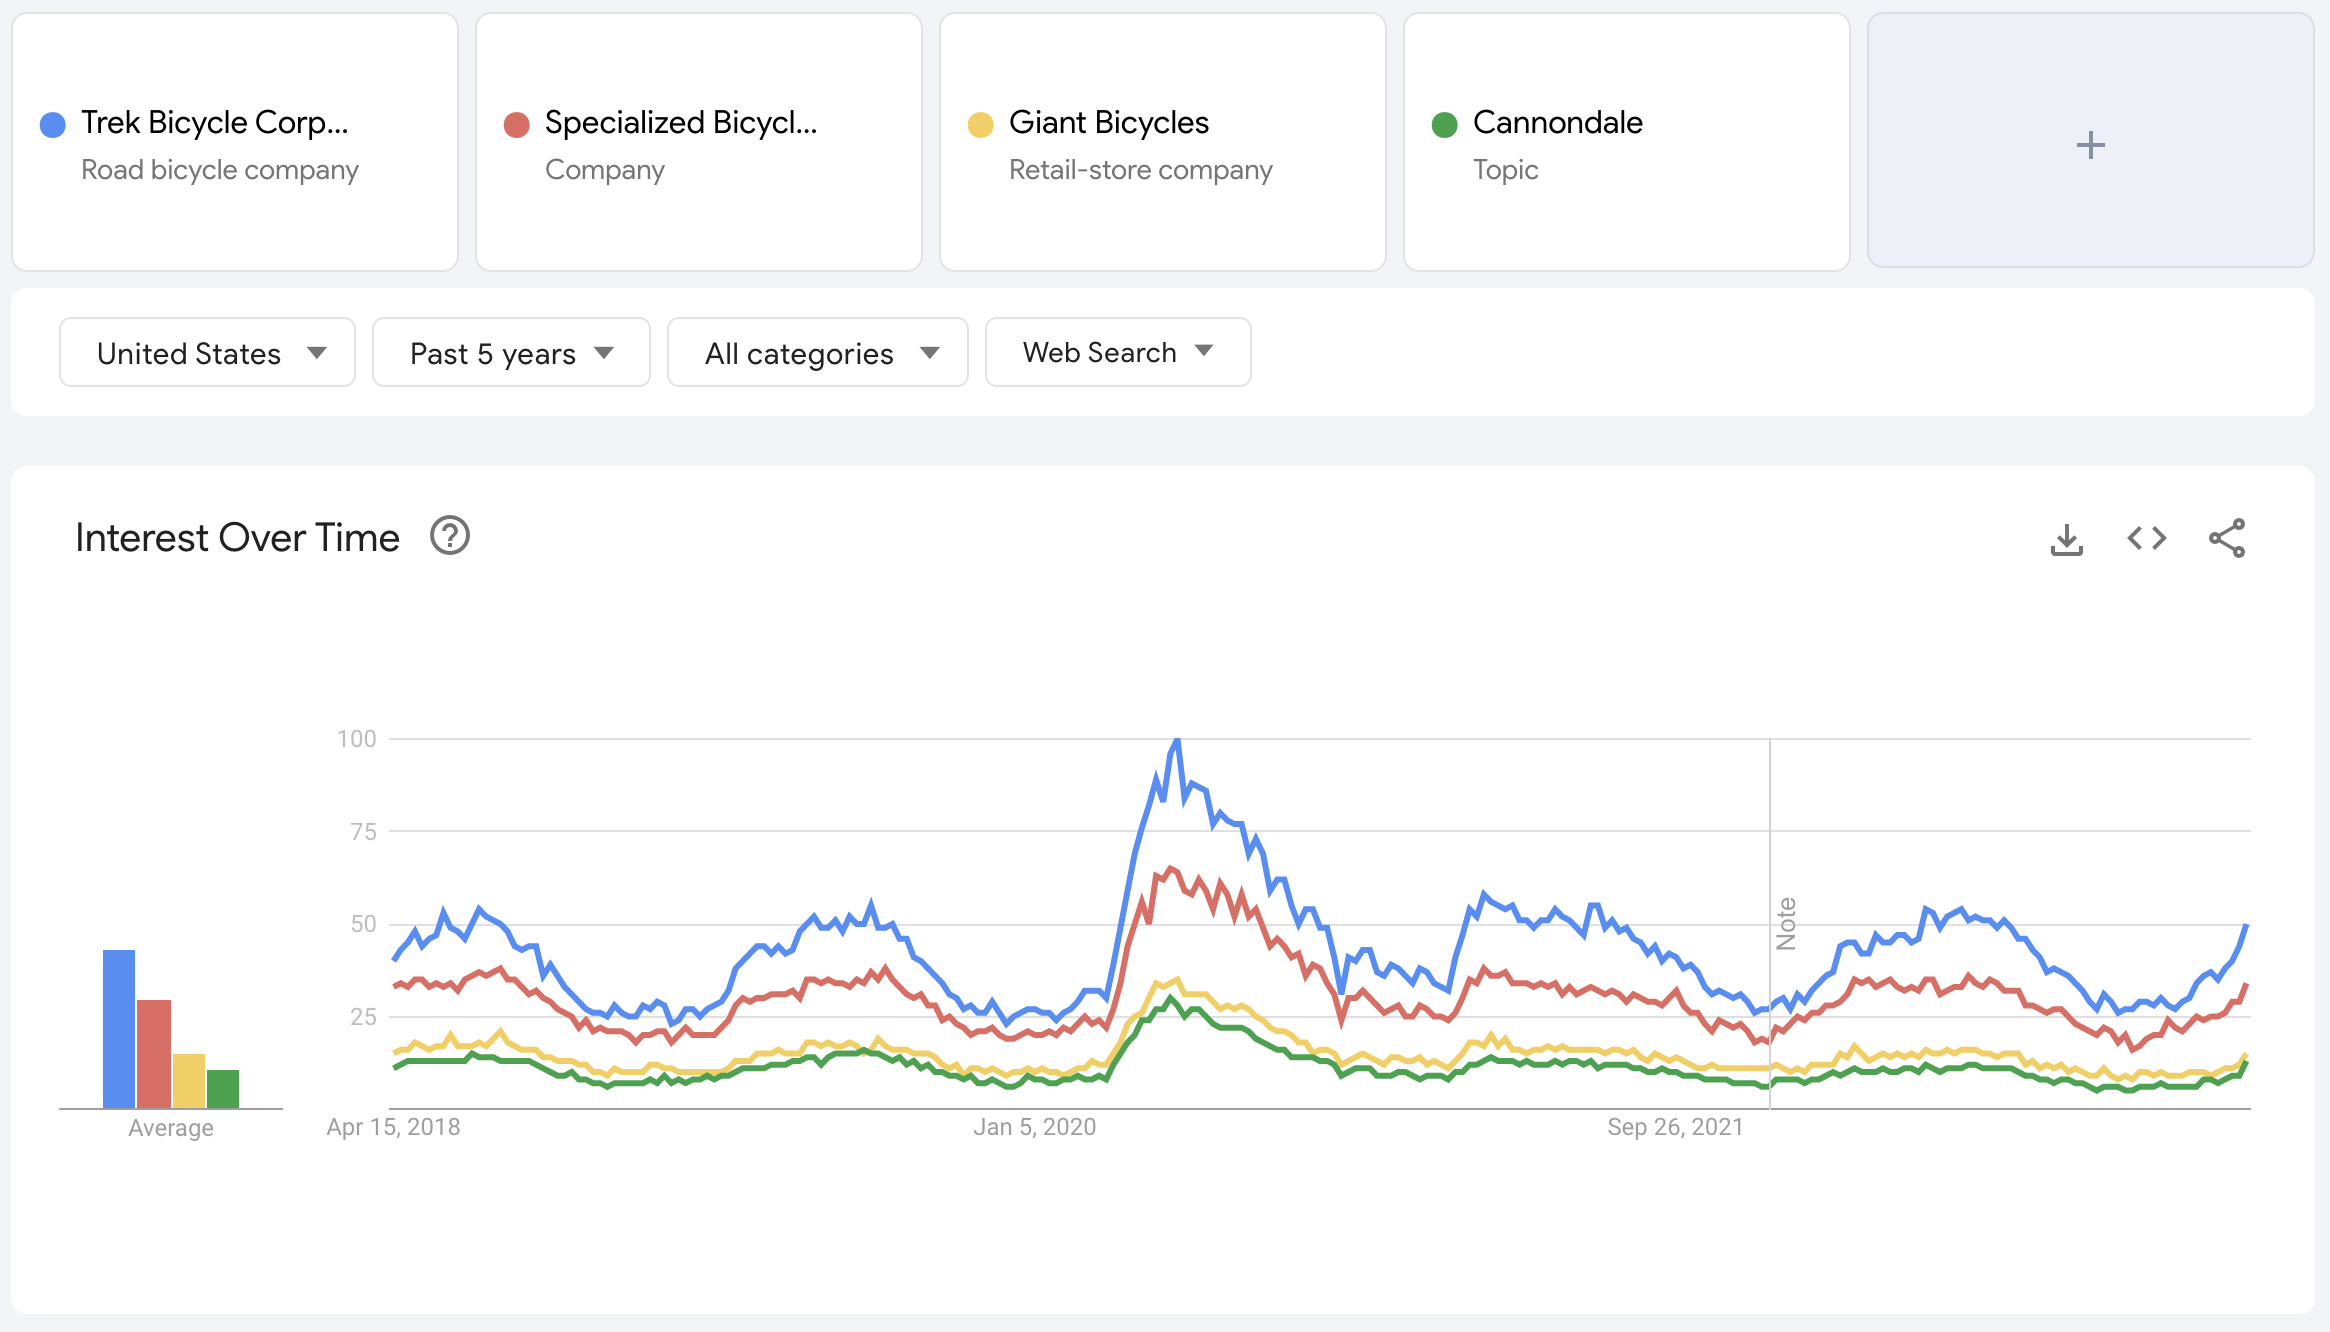
      Again, we see search interest lagging behind 2022. Let’s examine the numbers:

      Weekly search volume for major bike brands (topic), 2022 vs. 2023 
      WeekYOY change
      TrekSpecializedGiantCannondale
      last week Feb/first week Mar-3%-15%-18%-22%
      second week Mar-16%-13%-35%-18%
      third week Mar-23%-18%-28%-26%
      fourth week Mar-17%-23%-35%-33%
      last week Mar/first week Apr-21%-13%-22%-16%
      second week Apr-6%-11%-8%-11%
      average change (%)-14%-16%-24%-21%

      Unsurprisingly, Trek and Specialized appear to be doing better than Giant and Cannondale, but notably still down in search interest YoY.

      On the whole, search demand for some of the top bike brands appears to track relatively well with the decrease in overall search interest for bikes.

      6. Bike brands: keyword volume and trends

      Another question that came up as I continued researching bike brand trend data was whether there were brands that were actually improving YoY in regards to search demand.

      I compiled a list of over 100 bike brands and used Google Keyword Planner to pull data for average monthly search numbers and YoY change for similar bike brand related keywords in the US. 

      I used “[brand] [bikes]” as my keyword structure to ensure the searches were related to bikes instead of topics that could be collected by only using brand names. (See below for information on the difference between topic- and keyword-level data in Google Trends.)

      Twelve bike brands with increased search volume, Jan – mid April, 2022 vs. 2023 
      KeywordYoY change
      engwe bikes222%
      prevelo bikes90%
      sage bikes85%
      lectric bikes83%
      alchemy bikes53%
      stromer bikes49%
      revel bikes22%
      canyon bikes22%
      specialized bikes22%
      aventon bikes22%
      strider bikes22%
      priority bikes22%

      Of 107 bike brands, only 12 showed positive YoY growth for their main “[brand] [bikes]” keyword. Most big brands are absent entirely, and 25% of the growing brands focus on electric bikes.

      bike data thumbnail

      Get the Data

      All the 2023 data we collected is available in Google Sheets format. Peruse, make a copy, and develop insights of your own.

      We’ll also add you to our newsletter list. Unsubscribe any time.

      Section 2: Organic traffic trends for major bike manufacturers, big online retailers, and large brick and mortar bicycle retailers

      For the final section of the report, I wanted to cross reference our search trend data with organic traffic info pulled from some of the biggest sites related to bike retail.

      By examining organic traffic trends we are more or less measuring how many people went looking for a site or were brought there by an unpaid search result.

      An added benefit of measuring organic traffic is that it can be measured for any site through Google Analytics, so if you’re a bike shop owner or manager, make sure to see how these trends compare with your own data. And if you have no idea what Google Analytics is or want to better utilize this powerful tool (or would like help with search engine visibility), get in touch with us.

      For this section of the report I used the domain comparison tool within SEMrush, one of the leading SEO and marketing tools in the industry.

      It’s important to mention that a site can grow organic traffic by adding content and optimizing search engine ranking factors, or lose traffic by screwing things up. So when we look at individual sites below, we can’t know for sure if increases/decreases in traffic are due to consumer preferences or changes in search engine visibility. 

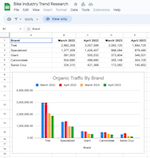
      1. Biggest bicycle brands

      I’ll start this section with a report on the big bike brands, since we’ve already taken a look at how they fared from a search interest perspective via Google Trends.

      The date range for this report and the following ones is March 2022 to April 2023. Each month is a snapshot of the amount of organic traffic that site received on the 1st of the month.

      A screenshot from semRush showing organic traffic to 4 top bike brand websites over time.

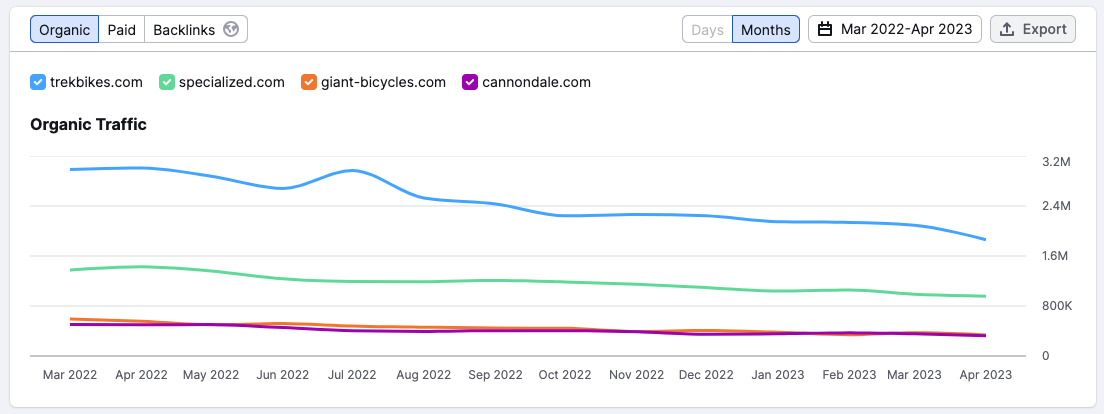
      One thing is clear immediately, organic traffic is down YoY. Let’s see how much:

      Year-over-year change in organic traffic for major bike brands 
      BrandMarch 1st '23April 1st '23Average change
      Trek-30%-37%-34%
      Specialized-28%-31%-30%
      Giant-37%-38%-37%
      Cannondale-30%-39%-34%
      Total-31%-36%-35%

      April was down more so than March for all brands compared, with the average change of the top four brands’ organic traffic amounting to -35% for the two months sampled.

      I also wanted to look at how medium-sized brands fared. For this comparison I went with brands with comparable organic traffic that either carry mountain bikes exclusively or lean heavily in that direction. I chose the MTB category because mountain was the category with one of the highest levels of search interest, and because it’s one of my favorite ways to ride.

      A screenshot from semRush showing organic traffic to 5 medium-sized bike brand websites over time.

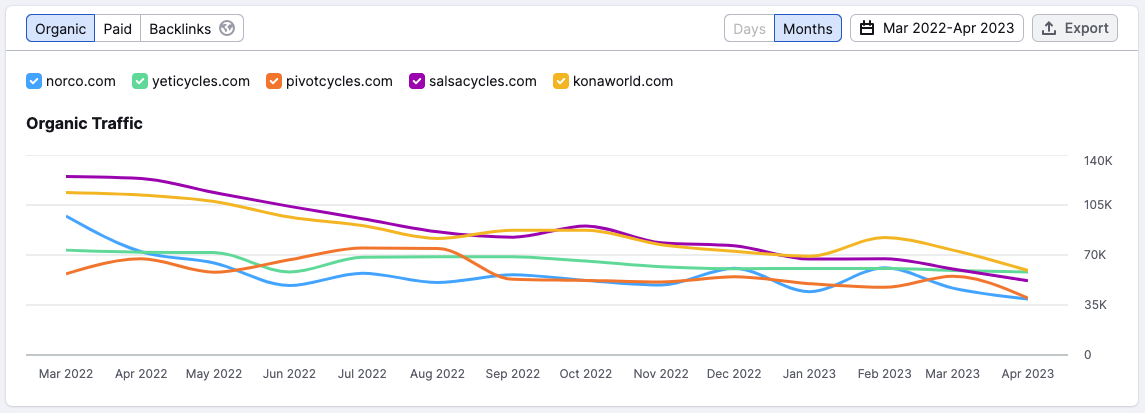
      Again, we’re seeing a YoY decrease in organic traffic. As the chart below shows, there was more variation in these brands, but taken as a whole they amounted to a similar percentage decrease from last year.

      Year-over-year change in organic traffic for medium-sized bike brands 
      BrandMarch 1st '23April 1st '23Average change
      Norco-52%-45%-49%
      Yeti-19%-17%-18%
      Pivot-3%-40%-22%
      Salsa-52%-58%-55%
      Kona-35%-46%-41%
      Total-32%-41%-37%

      Of the medium-sized brands, Yeti looks to have come through better than others, although Pivot had a great March. April was generally a worse month for these brands, which tracks with what we saw for the big four above.

      I couldn’t talk about popular mountain bike brands in the US without mentioning Santa Cruz, but my research (and the fact that my cousin works there) led me to give them their own section. Santa Cruz is more or less in their own category in terms of organic traffic, falling well below the big four but well above the medium sized MTB brands I sampled.

      9JiXYUymQGYWmSfnA7lsdSNC2Ba5gKbHga JVN 6TyWBkFtkhNQgHHOrUGoSbEEQpO 378aZkA3IvMvEMTBxFiKMwfKjNekF KKobyHMxUH XUQxM4lUhgiLJXbNcjxHTGt7WeRMlBraLURKb 5SFg

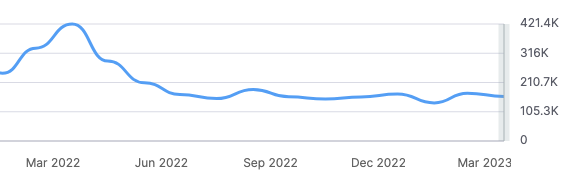
      While they were special enough to get their own chart in this report, that advantage seems to have no positive impact on their YoY organic traffic, which was down more than the other brands sampled.

      Year-over-year change in organic traffic for bike brand Santa Cruz 
      BrandMarch 1st '23April 1st '23Average change
      Santa Cruz-49%-62%56%

      If the seemingly endless promotions and sales weren’t a good indication of the predicament that the major bike brands are in, the picture that organic traffic trends paint certainly provides more clarity.

      2. Large online retailers

      Next, I looked at some of the biggest online retailers in the cycling industry.

      PhitRSGM FjfluY43X W78PBHgyVJZG196K6s0BVlhPFQ7GkIgbS sjCRsOayWhpykAUOI5Kmt4YsrcMFpeTNz9Pkfw2d1SH mDkFYxgNqinMKZH0Rcyu81vnsoSSe685gHSjANRoWcPRCqS 2Q5ig

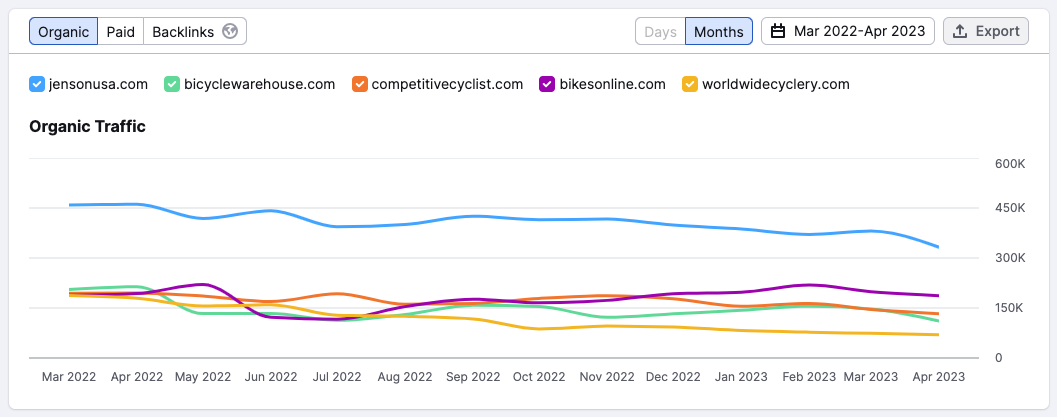
      I settled on these 5 sites because from what I can tell they are the online retailers with the highest amount of organic traffic. 

      It’s interesting to see just how much more traffic share Jenson gets, whereas the rest of the sites get comparable traffic. The relative stability of Bikes Online is also notable.

      Year-over-year change in organic traffic for top online retailers 
      Online RetailerMarch '23April '23Average Change
      Jenson USA-17%-28%-22%
      Bicycle Warehouse-28%-48%-38%
      Competitive Cyclist-25%-32%-28%
      Bikes Online6%-3%1%
      Worldwide Cyclery-61%-61%-61%

      The average decrease of the top four sites’ organic traffic was 16% in March, 28% in April. I’m excluding Worldwide Cyclery there because their drastic decrease seems out of step with the trends of the rest and may be the result of factors I don’t have insight into currently.

      3. Large brick and mortar businesses

      Finally, the last part of my research relates back to local bike shops. I selected these 5 companies by identifying which businesses had multiple physical locations and high organic traffic, using information from Bicycle Retailer and SEMrush.

      MncbCE21hKZFZk5v1t5qQs1QZeUY0SuogbpmjqaeVVcU7r6CD7R d d68VHcL3rUCXhF2G7wAwy76VkulQ0lhidvnd

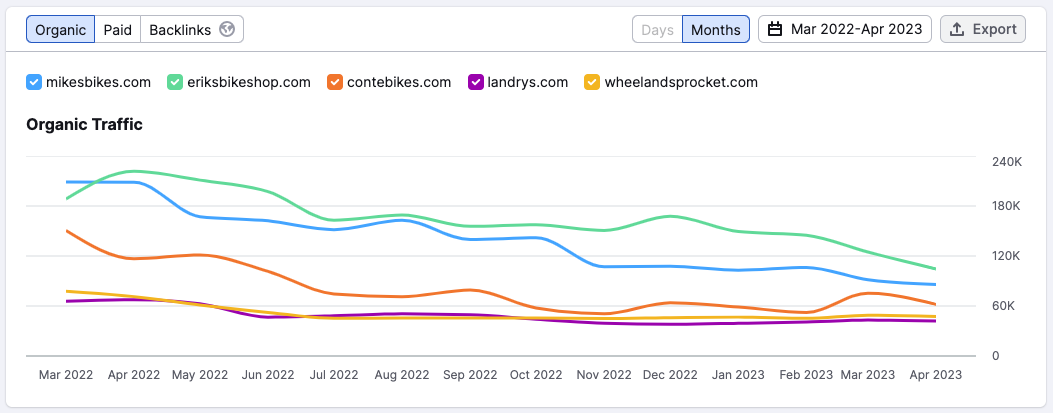
      Before I even started this research I had a sneaking suspicion that online retailers would be weathering the storm better than local bike shops in terms of search, and it appears that I may be right about that. My hunch (which is hardly unique) is that after struggling to find products in their local stores, some customers likely formed a habit of shopping online, and this data seems to back up that hypothesis.

      Year-over-year change in organic traffic top multi-location bike shops 
      Bike ShopMarch ‘23April ‘23Average Change
      Mike's Bikes-56%-59%-58%
      Conte's Bikes-50%-47%-48%
      Landry's Bicycles-34%-38%-36%
      Erik's Bike Shop-34%-53%-43%
      Wheel And Sprocket-37%-33%-35%

      The average decrease of organic traffic for the selected bike shop sites was 42% in March, 46% in April. It isn’t clear if 2023 will get worse than it is now, but it is clear that these big brick and mortar bike shops are losing business to online retailers in addition to a general decline in consumer interest related to cycling, which makes hitting those sales numbers difficult.

      2023 Doesn’t Look Like a Bounce-Back Year

      From my research on search interest and organic traffic for bikes, local bike shops, big brands, different categories, and online retailers, it looks like 2023 isn’t shaping up to be the bounce-back year everyone in the bike industry was hoping for–at least in terms of search demand so far. 

      Let’s go back to the original questions I posed at the beginning of this report and review the highlights so I can summarize what the data indicates:

      How does search demand across the bike industry compare this year versus last year?

      Search demand in March and thus far in April is down overall across all reviewed areas of the bike industry. At its broadest, search interest for all things bike related is down about 15-20% YoY.

      How do search trends for different areas of the bike industry compare against each other?

          • Local bike shops searches have dropped more drastically (28%) than searches for bikes in general (17%).

          • Mountain bikes were the most popular category until late 2021, when electric bikes became (and are still projected to continue to be) the most popular category. Gravel bikes showed consistent growth from 2018 to 2022, but seem to be leveling off in 2023.

          • Organic traffic for major brand websites has dropped 36% and large brick and mortar businesses have seen a 44% drop, while big online retailers have only dropped 29% (22% if we exclude Worldwide Cyclery.) To me this indicates a shift in buying behavior that may have been masked by the wildly high demand of the past few years.

        How might the 2023 season shape up from a consumer demand perspective in the bike industry?

        Based on the data above, I’m projecting that we could see upwards of 15-20% YoY revenue declines across the bike industry as a whole this season. Unfortunately, the research indicates that local bike shops will be hit harder than big brands and large online retailers, with revenue declines that could range between 30-50% or more.

        That’s not to say my prediction will be reality for bike shops across the US and Canada, as there are lots of factors in play, but it could be a fair average estimate. The good news is that there are actions that bike shops can take to mitigate losses.

        How Bike Shops Can Create Online Resiliency

        A few of the tactics I’ve found that can help independent retailers compete with larger online stores and even grow revenue online include: 

            • Treat your website as one of your business’s most valuable tools

            • Claim and manage your Google Business Profile

            • Invest in ecommerce and expand your market

            • Build stellar content that’s unique, easy to digest, and solves customer questions

            • Use search engine optimization tactics and best practices to rank higher and more often, while bringing more visitors to your site

            • Use pay-per-click advertising to move product and gain visibility

            • Use tools like Google Analytics to gain insights into what’s working and what’s not

            • Build an email list and send your subscribers engaging, helpful content

            • Foster online community with an active social media presence

            • Be an engaged member of your physical community

          I started this research in order to help our bike shop clients better understand the volatile market they’re operating in so we could help them set expectations and strategize accordingly. If you’re a shop owner or manager who wants to discuss any of this information, or who has questions about how to help your business succeed in the years to come, please feel free to reach out and say hello. As a former bike shop manager myself, I would love to be able to help in any way I can.

          Thanks for reading!

          brett picture mountain bike
          - Brett

          Notes on the data in this report:

          tools and datasets used

          I used publicly available data from the following tools:

            • Google Trends for comparing search interest
            • Google Keyword Planner for keyword research
            • SEMrush for comparing website traffic

          dates compared

          The goal for this report is to give bike shops a look at how the season is shaping up so far from a search demand perspective. Since the busiest month in terms of bike related search demand is May, I wanted to publish this a few weeks in advance. It’s not a huge sample, but the 6 weeks I looked at definitely paint a picture.

            • The comparison starts on the last week of February/first week of March, 2022 and 2023
            • The comparison ends at the second week of April, 2022 and 2023

          search terms vs. topics in google trends

          We leveraged topic-level data and keyword-level data in this report, which accounts for some differences in data trends for similar terms. A single specific query analyzed as a search term may often show different trends than the entire topic that includes all queries related to that search term.

          Share This Post

          Share This Post

          have you registered?

          Our next free digital marketing seminar is coming soon!

          [MEC id="946"]