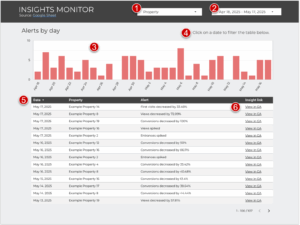
Monitor Google Analytics Insight alerts in a Looker Studio reporting dashboard, so you’ll always be on top of GA4 tracking concerns. Our tool combines GA4, Google Sheets, and Looker Studio to make regular monitoring of Custom Insights easy to stay on top of.
Skip to the video walk-through at the bottom of this post.
When Tracking Breaks
There are countless ways Google Analytics tracking can break:
- A website update results in forms not tracking
- An undetected bot drives spurious user counts
- A cross-domain tracking issue falsely inflates sessions
- And so on, and so on…
Google Analytics doesn’t have a built-in method for alerting when one of these things happens, but you can create a custom Insight based on a metric variation and have it sent to an email address when it is triggered.
At Two Octobers, we monitor a lot of Google Analytics properties. It became unwieldy to sift through all of the insights emails, so I built this simple tool to aggregate them into a Google Sheet so we can efficiently keep an eye on things.
How the Tool Works
- You create custom Insights in Google Analytics
Custom Insights can be configured to send an email when changes in specific metrics exceed thresholds you set. - The Google Apps Script checks for new Insights
Each time the script runs in the Google Sheet (via daily trigger or on-demand), it uses Gmail’s search syntax to find all Insight emails received since the last time it ran. - The script parses relevant data
For each matching email, the script pulls out:-
- Google Analytics Property Name – e.g., “mywebsite.com”.
- Metric & Frequency – e.g., “Users | Daily”.
- Alert Text – the details of the Insight message.
- Detail Link – a link to view the Insight in Google Analytics.
- Timestamp – when the email was sent.
-
- The script writes parsed data to the Spreadsheet
New rows are bulk-appended under a simple header (Row ID, Datetime, Property, Metric, Frequency, Alert, Link), giving you a chronological, structured view of every Analytics insight. - Looker Studio reporting
Once the alerts are in a spreadsheet in tabular form, you have a lot of options for efficient monitoring. I’ve included a Looker Studio template here as one option.
Creating Insights
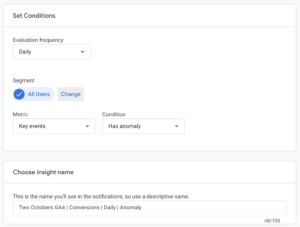
- See my blog post on setting up Custom Insights for detailed steps, as well as tips for what to alert on. We typically create Insight alerts for changes in Entrances, Views and Key events.
- Name the custom Insight precisely. The monitoring script is set up to parse out a specific format of Insight name:
[GA property] | [metric] | [frequency] | [condition]
Using this format is required for the Metric and Frequency columns to populate correctly. The ‘Insight name builder’ tab on the Sheet template has a formula for creating Insight names in the correct format. - Make sure to set the email notification to be sent to the same Google account you use to configure the Google Sheet and Apps Script. This saves you a lot of authentication rigmarole.
- Name the custom Insight precisely. The monitoring script is set up to parse out a specific format of Insight name:
- You may want to wait a few days for some alerts to happen before setting up the Google Sheet. If you don’t have any alert emails, it will be hard to verify that the script is working properly. Sometimes I also create an alert with a really small percent change threshold, just so I have something with which to test.
Configuring the Google Sheet
- Create the Google Sheet
The Sheet will be running a Google Apps Script. These instructions assume you have a basic understanding of how to run scripts in Google Sheets. If you do not, I recommend starting with Ben Collins’ Introduction To Google Apps Script.
To get started, you can either:
-
- Copy my template
Note that the template has some sample data in it. The Link column on the ‘insights’ tab has been obfuscated so the links don’t actually work. When you copy the template, delete all but the header row on the ‘insights’ tab.
- Copy my template
-
- Or Create a new Sheet and copy & paste the script
Click ‘Extensions > Apps Script’, then click on ‘Untitled Project’ and give it a name. Then delete the myFunction() placeholder function and copy/paste the script from github.
- Or Create a new Sheet and copy & paste the script
- Configure Script settings
- Go to the Extensions menu, select Apps Script, and make a few edits to the code.
- Replace the SHEET_ID constant with your own Google Sheet’s ID (the long string of letters and numbers in the URL).
- If you receive alerts in a language other than English, change the value of SUBJECT_CONTAINS to whatever matches the beginning of the subject line in the Insight email.
- Run the checkForInsights() function. You will be prompted to authorize various permissions to the script. Confirm all.
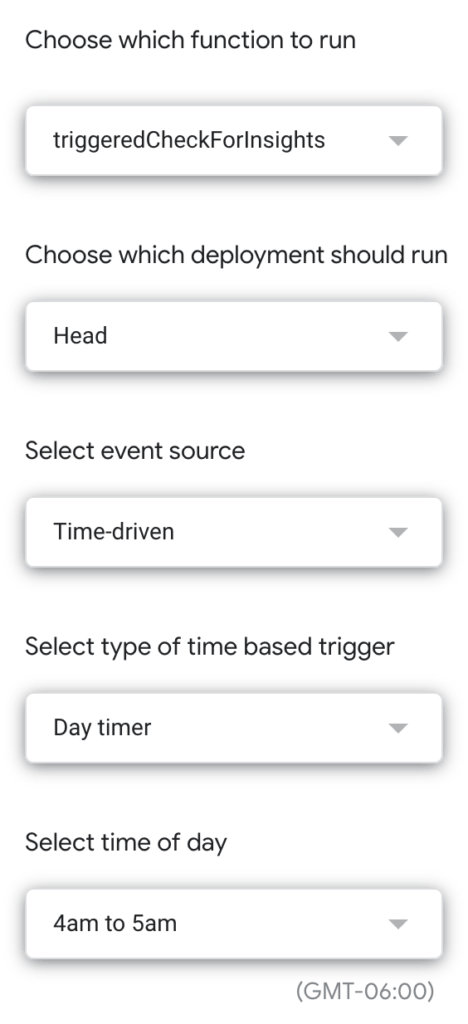
- Create a Time-Based Trigger
- In the Apps Script Editor’s left menu, open ‘Triggers’.
- Add a trigger for the triggeredCheckForInsights() function.
- Choose which deployment should run: Head
- Select event source: Time-driven
- Select type of time based trigger: Day timer
- Select time of day: whenever you’d like the script to run
- Run a Backfill (optional)
The checkForInsights() function gets all Insights sent yesterday and today. To populate the sheet with Insights prior to yesterday, you need to manually execute backfillInsights() in the editor. By default, it will backfill 90 days. To increase this number, change the value of the DAYS_TO_BACKFILL variable.
Using the Dashboard
Here is a template dashboard you can use to get started with Looker Studio reporting. The Insights in the dashboard are real, but I’ve obfuscated the property names and Google Analytics links. To use it:
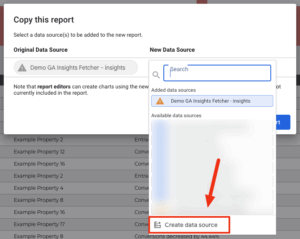
- Copy the template by clicking the three dots in the upper right corner and selecting ‘Make a copy’.
- Then click ‘Create data source’ to connect to your Google Sheet, and Select the ‘insights’ tab as the Worksheet. Leave the selected Options as is.
- Add a calculated field to the data source named ‘Insight link’ with the following formula:
HYPERLINK(Link,”View in GA”)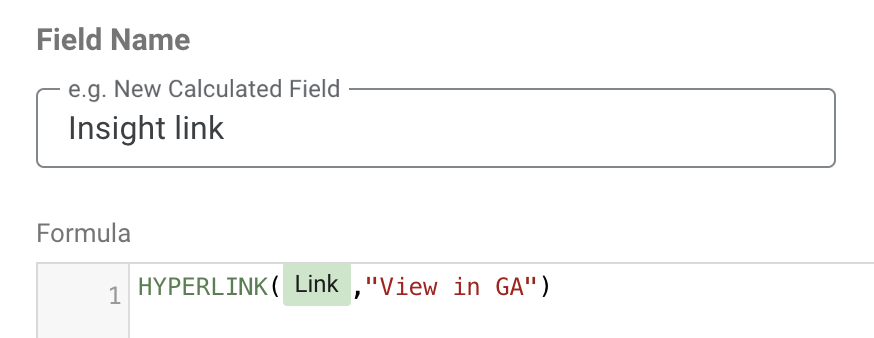
- Change the default date range of the date picker to the last 30 days or whatever time period you would like as the default. I set it to a fixed range in the template dashboard to align with my sample data.
the dashboard
The Insights Monitor dashboard includes a chart with the number of alerts by day, and a table detailing each alert.
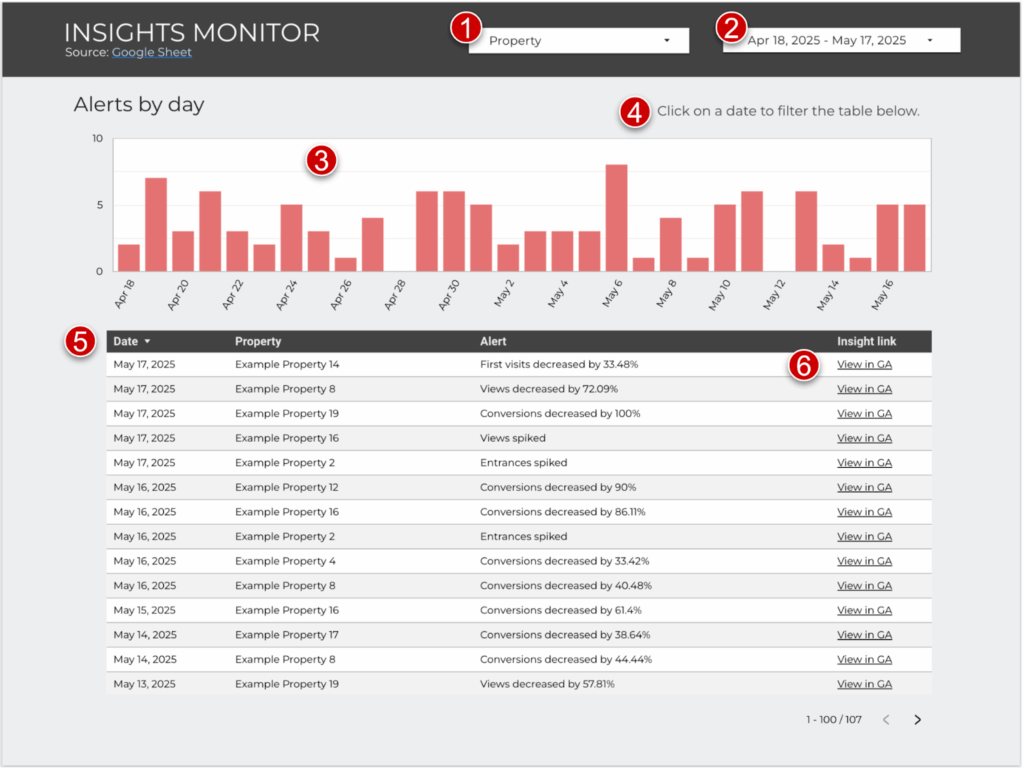
- I included a property selector in mine because we monitor a bunch of properties. If you are setting it up for just a few, you may want to remove this dropdown.
- Don’t forget to change the default date range.
- The chart is a time series with the series type changed from line to bar. If you configure it as a regular bar chart, it will only show dates that have alerts, whereas a time series will show all dates in the date range.
- Cross-filtering is enabled on the chart, which means you can click on a bar to filter for that date in the table below.
- The Datetime field has been renamed to ‘Date’ and is formatted as a date rather than a datetime.
- I chose to have a separate link column, but you could also use the alert description as the link text and use one less column.
Let me know in the comments below if you run into any issues or have ideas for improvements, and reach out if you’re looking to elevate your marketing data analytics.
Video Walk-Through
Like what you See?
Sign up for our newsletter! Nico’s monthly Analytics Roundups cover the latest in marketing analytics and share our latest blogs & video how-tos.


