The deadline to switch to GA4 is approaching, are you ready?
Businesses of all sizes and industries are faced with navigating how to best prepare for the inevitable GA4 migration. And while it is somewhat of a steep learning curve, it isn’t all doom and gloom either. This updated version of Google Analytics is better geared toward marketers and carries with it a number of customer-centric measurements for you to understand your audience more accurately.
Two Octobers’ Head of Analytics Nico Brooks walks us through the details in this recording of a webinar from August 2022.
Webinar Recap
What We’ll Cover
- GA4 in a nutshell
- The impact of GA4 for on your business:
- What it takes to to get up to speed
- What are some of the benefits you get from from having GA4 in place?
- When to switch
- Why organizations generally under-invest in in analytics
GA4 in a Nutshell
The original announcement that Google made about GA4 was in October of 2020. They’ve since said they’ll call current version that everyone is using, “Universal Analytics,” to differentiate between the version that we’re familiar with and GA4.
Google will stop processing new data to Universal Analytics July 1, 2023. That means that you’ll still be able to log into your account and see data collected up until that date, but you won’t be able to see any data after July 1, because it’s not being collected in Universal Analytics. That’s a huge deal. The purpose of collecting data is to understand how people are engaging with our website, and the things that we want to know all benefit from historical context. A lot of what what we use analytics for is to understand trends over time. If you want to see trend data, there’s a lot of pressure to get up to speed and get your GA4 set up properly.
A Quick Timeline
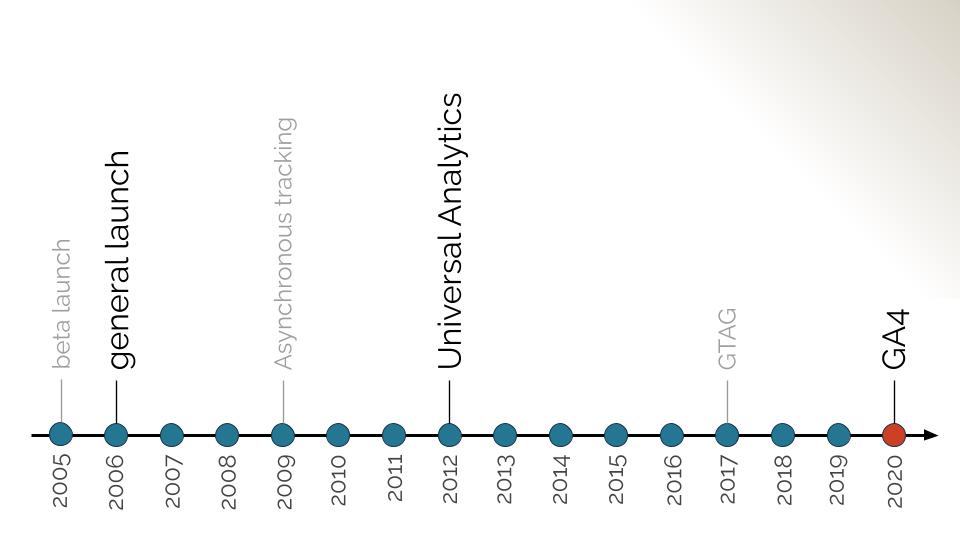
2005. The very first version of Google Analytics was launched in 2005. It was invite-only, and based on a tool bought called Urchin. It didn’t look anything like the Google Analytics you know.
2006. In 2006 everybody could have a Google Analytics account. The version that launched in 2006 looked very much like what you know: the layout, the color scheme and a lot of the standard reports were very much like what you’re familiar with.
2012. What they now call Universal Analytics launched in 2012. It included a pretty big change in how tracking worked as well as a refinement of the UX. If you were used to using Google Analytics, you didn’t need to learn the new interface; there were just some reports that hadn’t existed before. Plus, data collection capabilities really improved. But as a user, you could have been completely unaware of that launch.
2020. GA4 is announced. This is the first time that they’ve made a change where you must upgrade on a timeline.
GA4 vs. Universal Analytics: Key Differences
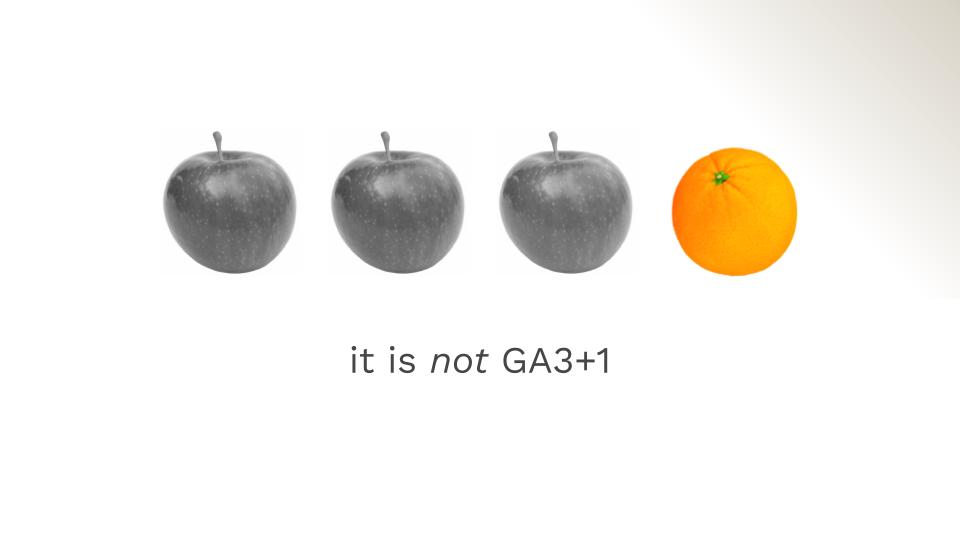
GA4 really is a profoundly different tool than Universal Analytics. While the use cases that it helps to solve—understanding who your audience is, understanding where they come from, what they do on your website, how your marketing channels perform—are the same, how it works is profoundly different.
- The reporting interfaces change completely.
- The event based data model. The design of Universal Analytics was built around the idea of pageviews, and hit types, including ecommerce transactions and various other events. With GA4, anything that is possible to track can be an event. The world of things that are possible to track is vastly expanded.
- The tags that you implement are new and different.
- The API is different. Anything you’ve set up in Data Studio has to be updated. And third party integrations need to be updated.
Third-Party Integrations with GA4
A lot of the work that will go into setting up GA4 properly will be here. Shopify ecommerce, Calendly sign-ups, ticket sales, integrating tracking with third-party tools installed on your site can get complicated to track in GA4. But if you just have a WordPress site where you’ve got a lead form, and maybe a few videos, setting up GA4 is a piece of cake.
Things That Went Away
- Segments has been replaced by a close equivalent called comparisons.
- Views and view filters. If you’re using views in analytics to do things like see different subdomains, or your website has a view that filters out internal traffic and a view that doesn’t, you can still filter out internal traffic, but you can’t create a view that does & a view that doesn’t for example. This is challenging.
- Bounce rate. This is a weird statistic anyway, because what it really meant was a single interaction visit in Universal Analytics. Somebody that comes and reads a blog post for half an hour could count as a bounce. They’ve replaced bounce rate with engagement rate, which is a little bit more meaningful in terms of identifying engaged users. It isn’t a one-for-one replacement, but it’s actually a better representation of the percentage of users that are actually engaging with their content.
- Behavior flow. GA4 has something called path exploration, but honestly it’s lame. You could use it to understand how people were engaging with your website and how they were moving through different sections of your website, but it’s much harder, so hopefully that’s something that they’ll be improving.
- Fewer reports. Universal Analytics has a ton of reports drilling into a whole wide variety of things, that’s really changed. You could argue that in GA4 you can use a single report and sort of change parameters to see more data. But there definitely are reports that have just gone away, and you would have to have recreate them to get them back.
- Numbered conversion goals. In Universal Analytics, you could say like a contact us form completion is goal number three, and then you could report on it specifically, and pull it into dashboards. That doesn’t exist anymore, we just have events, any event can be a conversion. It’s really annoying and tedious to pull out specific conversion events.
- Events, as we knew them. The way events worked in Universal Analytics was horrific. You were forced into this category action label designation, with no consistency in how those values were used, especially when third party tools generated events. It was a difficult interface to navigate, and you couldn’t pull those events into most reports. With GA4 you can actually use events to understand things about your website, because they exist in their own little walled garden, apart from everything else—it’s a huge step forward.
new features
- The overall architecture is is really a significant leap forward: the flexibility, the power of being able to set it up to do what you want it to do. That does mean work. It does mean you’ve got to know what you’re doing. But in my opinion, that’s always been necessary. It’s just that people didn’t do it with Universal Analytics. Now you’ve sort of have to.
- BigQuery integration. You can directly link data into BigQuery, a super powerful feature if if you’re doing significant data analysis. All event-level data goes directly into BigQuery. And you can actually use that real time if you wanted to, to create interactivity on your website—the integration is that close. (Read more about creating a marketing data pipeline.)
- App tracking.
- Multiple attribution models. I think this is one of my favorite things in GA4. We’ve all been suffering with Universal Analytics’ last-non-direct-click conversion attribution, where goal conversions are attributed to the last thing that somebody did before they converted. And so most of the time that was going to be a brand search in paid search, organic search. Because really how often do does somebody actually become a customer on their first visit? You attract them via social media, they leave, they come back later—but the way they come back is they type in your business name in Google like everybody does. And they click on it organic or a paid listing, and then they come to your website, and it gets attributed to that source.
GA4, by default, uses data driven attribution. It develops a model for how to attribute conversions based on how it sees different channels contributing to conversions, which is pretty amazing. And you can change it to a variety of specific models. - User dimensions. You can see dimensions both at the session level and at the user level. An example: the source of a visit is a session dimension, the source that a person came from the first time they visit your website is a user dimension. There are a variety of dimensions that you can see both at the session level and at the user level.
- Better architecture for custom events, dimensions and metrics. GA4 is built from the ground up with with the idea that you’re going to be taking advantage of custom events and tying them to your own dimensions and measure what’s really meaningful to you. The interface itself is very customizable—this is not obvious when you go in there. But you can define the ports that you want to see, you can add your own reports, the navigation and everything is very customizable.
- Explorations. Think of them as a cross between custom reports from Universal Analytics and Data Studio reports. One use case for this would be, “hey, we had a big traffic drop drop last month, I’m going to create some explorations on what caused this traffic drop, and then I’m going to share them with the team and everybody can see them.” It’s a way of creating custom reports within the interface.
Still the Most Powerful Free Tool Your Organization Uses
I’ve mentioned some good new things, some things that went away that are a little unfortunate. Something that I like to say is: Google Analytics is one of the most powerful tools you have on your computer that’s available to you. And it’s free! I think most people don’t appreciate how powerful it is. Because you don’t have to pay anything for it. Organizations are typically not motivated to invest a lot in setting it up and learning how to get the most out of it, but there are really a remarkable number of features, especially for something that’s free.
How GA4 Will Impact Your Business
Implementing GA4 Requires Technical Expertise
You are going to need a person or people with advanced expertise in Tag Manager, Data Studio (now Looker Studio) and GA, or a lot of interest and the aptitude to get there. Getting it set up properly is not for non-technical people. With Universal Analytics, it was possible to at least to get page view tracking working pretty well if you were not technical.
How Long will GA4 Setup Take?
For a website that’s just WordPress with a few forms and maybe some videos and a couple of other lightweight interactions is going to be a really quick setup, especially if you know what you’re doing. But it could be a serious undertaking, if you really want to take advantage of the power of GA4 for specifically creating custom events, custom dimensions and metrics based on those. And if you’re using Data Studio a lot, it will take a lot of time—GA4 doesn’t translate at all. A Data Studio dashboard set up using Universal Analytics data must be completely redone—you can’t just point to a new data source.
But if all you do is just get it set up, you’ll get immediate benefits: multiple attribution models, user dimensions, some really interesting new metrics related to ecommerce, automatic events like scroll tracking and video tracking. But most of the power of GA4 is going to take time and investment to reach.
GA4 Can Improve Your ORganization’s Analytics Maturity
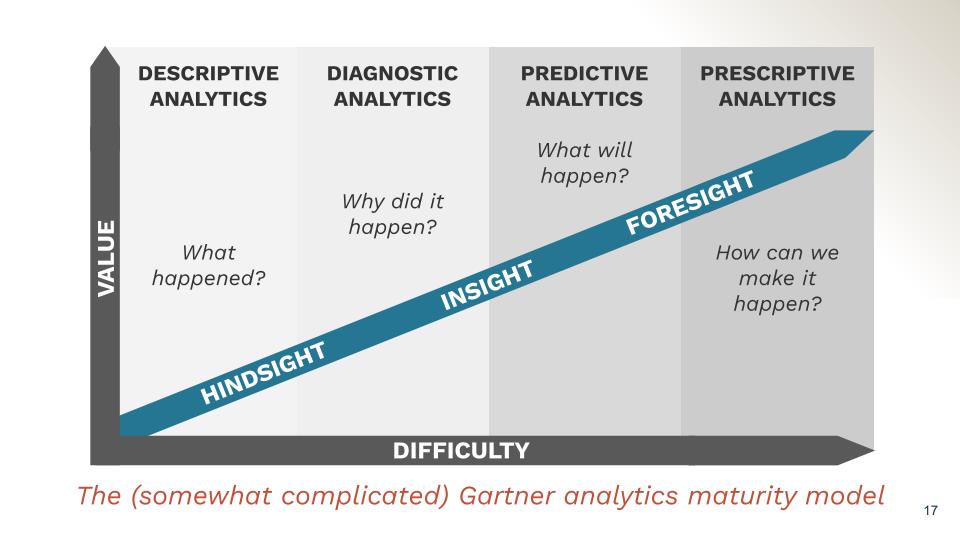
Gartner put together an analytics maturity model. The idea is that as an organization, or for a project, you can assess analytics maturity. On the left, we all start with descriptive analytics, like being able to understand what happened via analytics. Then we get to diagnostic analytics where we use the analytics data that we’re collecting to understand why things happen. The next stage is predictive analytics, where we start to use this data to create predictive models to understand what will happen. Finally that leads to prescriptive analytics where, for example, if you want to increase revenue, you start to predict changes in data, which can then inform a marketing strategy to get ahead of the game, and reach people based on on seasonal behavior. Prescriptive analytics is the goal at the end of the rainbow from a marketing standpoint—we’re using the data to create predictive and prescriptive models to say, if we do this, we’re going to be able to increase revenue, customers, or whatever the outcome it is that we’re trying to maximize.
We all want to get to prescriptive analytics. And in fact we have to get there if we want to compete in the world that we live in right now—many organizations are investing in predictive and prescriptive analytics, so just to keep up, we need to be there. GA4 is a much more powerful platform than Universal Analytics for descriptive analytics, because it has complete flexibility in what you’re tracking. How important are page views, really, to your business? Unless you’re a publisher, and you have a revenue per page view model, probably not very important. Page views doesn’t explain any kind of engagement; you can get a high number of page views by having blog posts that are irrelevant to your business, but have a lot of appeal and maybe have been around for a while. That’s what Universal Analytics is. Page views is the first thing it was built to track, and it’s the main thing it tracks still today. GA4 is much better at supporting the things that happen on a website that you care about.
GA4 also has better diagnostic analytics tools built in. Machine learning tools start to give you a feeling for trends like worth pointing out and anomalies. It’s not going to answer the question of why, but it’s going to get you a lot closer by highlighting changes, and the dimensions that correlate closest to why those changes have happened.
For predictive analytics, what’s valuable is the link into BigQuery, which is a very powerful platform for creating models around predictive analytics. You can create machine learning models directly in BigQuery to build predictive models, in addition to a variety of other capabilities. If you don’t use BigQuery, you can easily create a conduit from BigQuery into Snowflake or something else to do essentially the same thing.
Descriptive analytics is the foundation for all of this, because it’s what everything else is built on—when it is accurate and complete. I look at hundreds of analytics accounts a year, and I would say only occasionally do I come across one that is set up well, where I don’t, within a few minutes of auditing, find obvious problems with how data collection has happened. The analytics maturity model is wonderful. And we’ve had the tools to be there—you could have done so with Universal Analytics. It wasn’t the tool wasn’t the thing stopping you, you were the thing stopping you. And I know that sounds condescending and preachy. It is a little preachy, I apologize; it is a subject I’m super passionate about. It’s not like not like the Two Octobers Analytics account is set up perfectly, so I should not be casting any stones.
When to Switch to GA4
Now! Honestly, it’s that simple. You can run Universal Analytics and GA4 side by side. A year from now will be August 2023. Universal Analytics will have stopped collecting data in July and you will no longer have a year’s worth of data if you’re not already up to speed on GA4. There’s no reason not to do it, you’re going to have to make the investment at some point—you should do it now, so you’re collecting historical data.
Resources
- The Google Analytics demo account is great if you want to see how GA4 works. There is a Universal Analytics demo account and several GA4 demo accounts that you can have a look at.
- I Love Data. Benjamin Mangold has a both a mini and a comprehensive course on GA4 that are well priced. He explains things really well. He’s got videos walking through everything; I think he’s he makes it pretty easy to follow.
- Analytics Mania. I love Julius Federer for his thoroughness. His blog posts are unbelievably detailed, and he keeps them up to date, which is wonderful.
- And reach out to me.
- Google just released GA4 certification. I would say their training is pretty good. It’s fairly superficial, you’re definitely not going to know how to use the tool or troubleshoot after going through it. But you’ll really learn a lot about the features.
Investing in Analytics
Final case for investing in analytics. Let’s do some quick napkin math. Let’s say you spend $10,000/month on marketing and you optimize your marketing to conversion value (because of course you do—because we should all be doing that). But your measurement of conversions is off by 20%. You’re wasting approximately $24,000 a year because garbage in garbage out—you’ve got bad data that you’re building everything on.
Of course whatever data is incomplete doesn’t mean that everything you’re doing is wrong. But nonetheless, just think about that math. We get people all the time that wouldn’t bat an eye at spending thousands of dollars a month on Google Ads, but haven’t invested much at all in getting their analytics data collection accurate. A lot of the money that they’re spending is wasted.
Two Octobers can help
Two Octobers helps marketing teams feel confident in their website, lead, and revenue tracking. We offer GA4 migration services, one-on-one and small-group Google Analytics training, and build marketing dashboards for better real-time insights. Contact us to build a better foundation for your marketing programs.