You launched your new website, and you celebrated! (As you should! That was a lot of work.)
But you’re not done. Your website can get better.
You want more leads and sales. And of course, your boss wants marketing to drive growth. The key to getting more leads from your website is to always be improving it. Sound daunting? It’s not as hard as it sounds.
First, you need to understand what your key website metrics are. Then, you can identify opportunities for improvement.
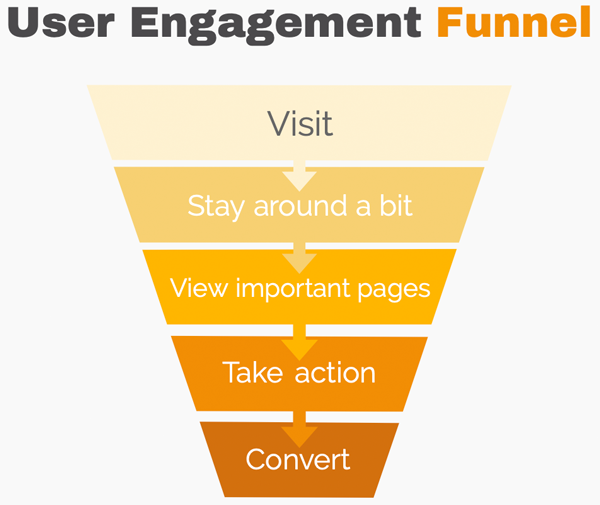
The User Engagement Funnel
I think of the ways people engage on a website analogous to a customer acquisition funnel. Let’s imagine a content-rich site where the product requires some consideration, like a B2B service. People:
- Visit,
- hopefully stay around a bit,
- visit some important pages,
- take some action,
- and fill out a lead form or make a purchase.
Each of these steps has a metric to measure. By improving the numbers at each stage of the funnel, we can in turn generate more leads and sales.
This type of model is useful for many types of businesses, but the steps will vary. If you buy a lot of traffic, or your website converts through a landing page pretty much immediately, your users start lower down in the funnel. On an ecommerce website, any product page is probably a key page, and sessions with more than one page are not as relevant, so you might remove that step.
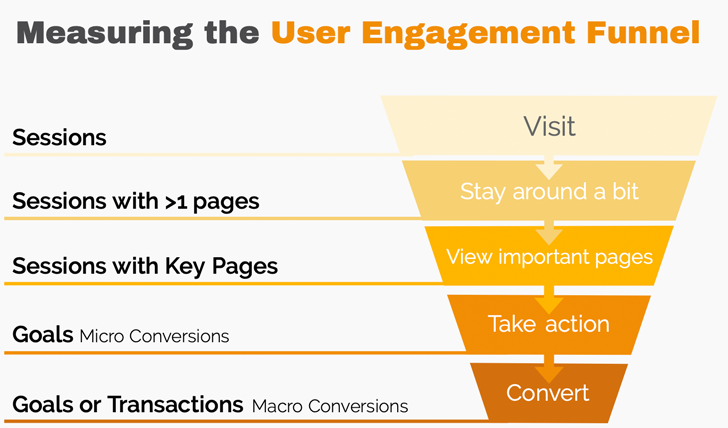
Measuring Stages in the User Engagement Funnel
Let’s talk about what each of those steps means.
- Funnel Stage: Visit the website
Metric: Sessions
This is simply all the visits to the website (that’s a layman’s definition of sessions, here’s the technical definition), and it tells us how much exposure your website has had. You could use the Google Analytics metric Unique Visitors, which would tell you how many people came to the website, but I prefer Sessions, which is the number of independent visits, sometimes by the same person.
Find this metric on the Audience > Overview page of Google Analytics. - Funnel Stage: Stay around a bit
Metric: Sessions with more than one page
This is a measure of elementary engagement. If people like what they see when they visit, they’ll dig a little deeper. So how many are interested enough to see a second page?
Find this metric at Audience > Behavior > Engagement > Page Depth. From your total Sessions, subtract the number of Sessions that are <1 or 1 page depth. - Funnel Stage: View important pages
Metric: Sessions with key pages
Let’s be honest, some of the pages on your website are worth more than others. The privacy policy page? Important for decency and credibility, but not a good indicator of a visitor’s commercial interest in your business. Think through which pages a future purchaser is most likely to check out before they contact you. For your business it might be the service descriptions, case studies, the team bio, or the shipping info page.
Find this metric at Audience > Overview, applying a Custom Segment as shown below.

- Funnel Stage: Take action
Metric: Goals
Most websites have an action users can take when they want a little more information that doesn’t actually represent a lead just yet. I’ll give you a few examples from our clients: for an insurance website, submitting basic info to get a quote; for a furniture retailer, ordering a swatch; for a b2b site, signing up for the email newsletter. If you don’t have one, you can skip this metric.
Find this metric at Conversions > Goals > Overview, adding up the Goal Completions of the appropriate goals. - Funnel Stage: Convert
Metric: Goals or Transactions
This is the big kahuna, your ultimate goal for website visitors. Could be a phone call, filling out a lead form, or making a purchase.
Find this metric at Transactions from the Conversions > Ecommerce > Overview report if you have ecommerce configured on your website. If not, find this metric at Conversions > Goals > Overview, adding up the Goal Completions of the appropriate goals.
Take a baseline reading of the metrics above for your website for the past six months (or since the last big change), and calculate the percentage that flows through to the following stage. Your data will look something like this:
| Funnel Stage | Metric | Value | % from previous |
|---|---|---|---|
| Visit | Sessions | 23,101 | |
| Stay around a bit | Sessions with >1 pages | 14,399 | 62% |
| View important pages | Sessions with key pages | 10,295 | 71% |
| Take action | Goals (micro conversions or secondary goals) | 1,475 | 14% |
| Convert | Goals/Transactions (macro conversions) | 315 | 21% |
These numbers aren’t meaningful by themselves, they just mark where you are right now. Every site’s ratios will be different. And an important thing to understand is not every individual user will go through each stage in the funnel–you could get a purchase from users not having completed a micro-conversion goal, for example. What this framework does is show at what level people are interacting with your website, so that we can start thinking about how to increase the number of people engaging more deeply.