I promise you there is a gem hiding inside your Google Analytics that will have a real impact on your business. It might be a piece of data whose impact can be felt beyond the website and into the core of your business. It may be something that could drive more visitors to purchase, uncover demand for a new product, or even identify new markets.
You just have to have the imagination and investigative skills to find it.
We’ve found several of these gems for our customers — in fact, we typically find at least one for each of our clients. In this blog post, I’ll take you through a couple of real-life examples where we’ve used Google Analytics (GA) to discover this kind of business-impacting data.
1. Checkout Behavior
One of the best investments for continuous improvement on an ecommerce website is to improve the conversion rate inside the checkout process. We’ve seen lots of small improvements to different checkout stages which result in big ecommerce conversion rate gains.
In Google Analytics, the Conversions > Ecommerce > Checkout Behavior report gives you the data about what’s happening as people go through the steps in your checkout process. (This is an Enhanced Ecommerce report; if you don’t see the report, you may need to set it up.) It shows how many people get to each stage in the checkout process, and how many don’t make it.
Take this: the first step in the checkout process for one of our clients. It raised some eyebrows because only 48% of people were continuing to the next step. What do you think? Anything jump out as a concern?
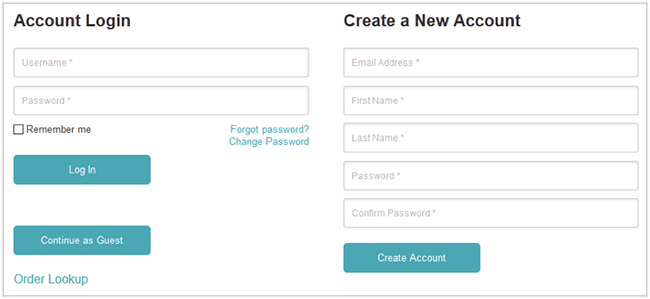
We thought it was awfully hard to tell that guest checkout was an option. See how it’s hidden down there on the left?
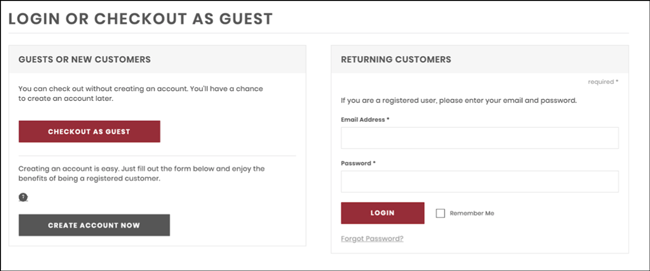
When they redesigned this screen to make the guest checkout option more visible, 82% of people continued to the next checkout stage. Imagine if you filled the checkout funnel with 70% more buyers: you’d have found a gem.
Here’s another idea. You don’t have to rely on what’s already built into GA, so in this example, I’ll show how grabbing some extra data during the checkout process helped find another gem. Add-on fees are often a source of shopping cart bounces. How is your shipping cost affecting purchases? One of our clients has different shipping options depending on where people are located and how big their purchase is. Here are the percentage of people who continued from the shipping page to the billing page.
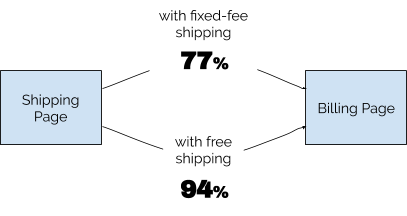
It’s not surprising that there was a difference. We know instinctively that free shipping is better, but free shipping costs money–how do we put together a business case that shows the additional sales it might drive? We set up Event tracking in Google Analytics to capture which shipping option was available to each purchaser, and then calculated how the different delivery options affected shopping cart conversions. Armed with this information, they could model out the business impact of expanding lower cost shipping options.
2. Product Insights
When you have Google’s Enhanced Ecommerce Tracking enabled, you’ll see lots of data about the products being purchased in reports like Conversions > Ecommerce > Product Performance > Product Category.
What you can do with this data is compare different merchandising strategies for different products. Your website is your playground for getting feedback on product changes. Test out featuring variety packs vs. singles. Determine the effect on the purchase rate of a product if you change the price of that product.
Many products companies sell their product through their website, as well as other channels. We had a client with thousandsof products who we were running a paid search campaign for. Their goal was $3 ROAS, a reasonable goal. But we struggled and struggled at around $2 ROAS. What was to blame? Were we not doing a good job? Was the website to blame? We suspected it was unavailable inventory. When we surfed around the site, we noticed that products that said “available” were often only available in a few sizes, not all sizes.
So we used the products report to get revenue by size. Then we compared it to inventory availability data we got from Google Merchant Center, in order to show that there was a correlation between in-stock % and % of revenue.
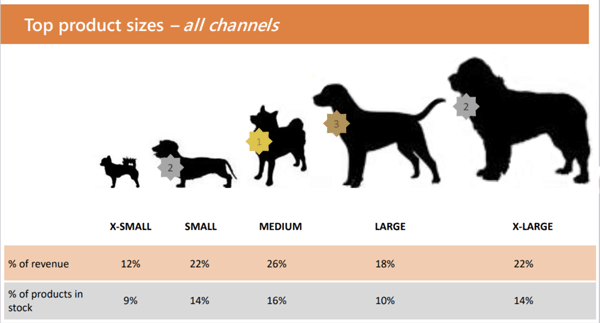
This company was wholesaling to someone else and giving that priority. But in doing so they generated inventory shortages on their own site, which was affecting their ecommerce conversion rate in the area they made better margins. This analysis gave them the data to understand how their multi-channel strategy was making it hard to succeed on their website.
3. Customer Demand
If you have been thinking that your website only tells you about what online customers want, you’re missing some real gems.
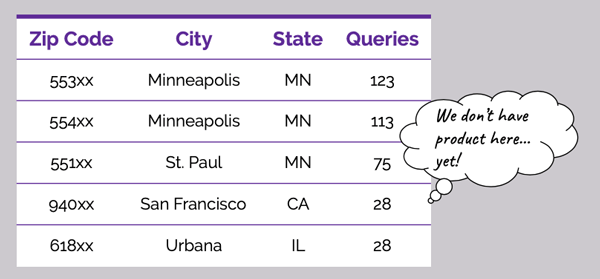
One of those gems is the search box on your website, where users will search for things you have *and* things you don’t have. If you have a way for users to search for products, or if you have a way for them to enter their address to find you in stores, you can capture that data. Google Analytics can share those search box entries with you. Search query data is reported in GA at Behavior > Site Search > Search Terms, though it does require some setup.
For one of our clients, we set this up to track what users typed into the “find a location” box. Then, we compared that to the list of locations where their products could be found. The exception list helped the client identify geographies ripe for expansion. And a comparison of offline marketing & sales expenditures compared to online searches in that region gave some perspective on the relative effectiveness of those costs in each market.

4. Audience Targeting
Demographics reporting in Google Analytics tells you the kinds of people interested in your brand and purchasing. We’ve run into numerous situations where the core target audience our clients research and developed their product for is doing well, but there’s another audience they hadn’t even considered that’s also doing well.
These kinds of reports are found in the Audience menu of GA.
Here’s a real-life example of this. Our customer had created and almost exclusively marketed their nutrition product to young men participating in a fitness niche. And younger men were indeed generating most of the revenue on their website.
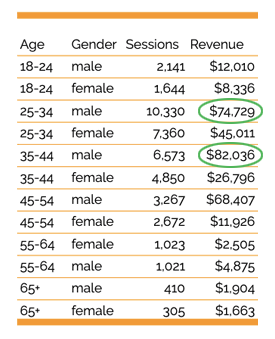
The gem of data is in revenue per session of all gender/age combos. The demographic that generated the second most revenue was older men. They were more likely to purchase, and purchase in bigger quantities.
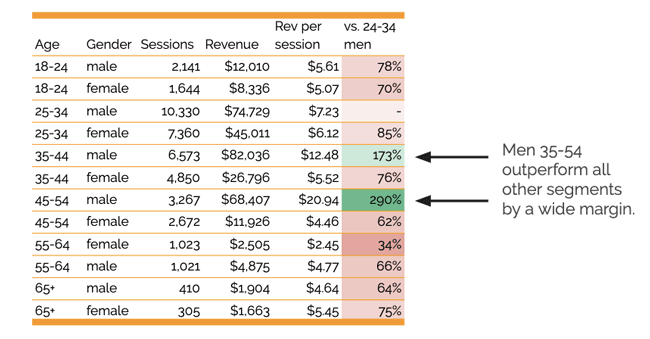
The client was pretty surprised. It was a target audience they hadn’t considered. They could definitely add marketing to this demographic. But another way of looking at it is, when we have limited marketing budgets (and who doesn’t?) we should focus them on our most profitable segments — those where the rate of purchase and revenue per product is better. So what we’ve uncovered here is a demographic to focus on that would actually generate more profit for the business.

The Beauty in Google Analytics
My goal here has been to open up your eyes to some of the great things you can find inside Google Analytics.
These are things that can actually have a big impact on your business:
- Increase purchases with incremental improvements to the checkout steps,
- Direct investments better by understanding what you don’t offer that your customers want, or
- Increase profit by identifying more lucrative audiences.
Google Analytics is a free tool. Probably all of you reading this post have it installed on your website. But because it’s free, do we take it for granted? When you drop in occasionally and take a look at top-level trends, you learn only a few tidbits about your website.
But when you actually take the time to set up Google Analytics to collect all your user inputs, and take the time to investigate and analyze your website trends at a deeper level, you can truly find some gems that can make an impact on your business of $10,000 or more.