My roundup of recent marketing analytics news and ideas that I find particularly useful and/or interesting. I mostly work in the Google analytics stack and I’m a little bit obsessed with the intersection of AI and analytics.
Just-in-Time Data Management
I want to share an ugly secret. Most of the time, when I get access to a client’s data warehouse, I find massive amounts of data that hasn’t been looked at in years, or perhaps ever. The fault is mine as much as anyone’s. There was a time when data storage meant Oracle licenses, RAID arrays and expensive database administrators. Cloud warehouses changed all that. Storage costs became negligible and the need for constantly tuning indexes and engineering backup strategies went away. Then people like me advocated for pipeline solutions like Fivetran, Airbyte and Supermetrics, so our clients could “own their own data”.
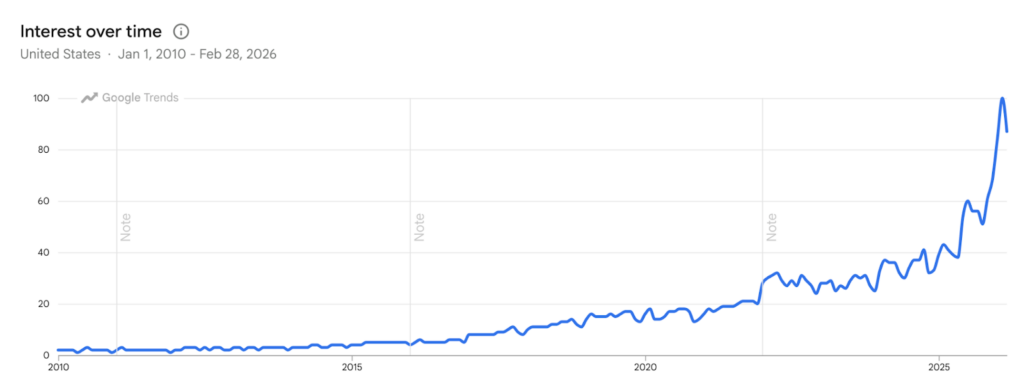
Along the way, a whole ecosystem evolved around the growing volume of stored data. When I was working in the aughts, there were no roles for “data engineers”, “analytics engineers”, or “data product managers”, nor was “data governance” a thing.
Google Trends data for the search term “data engineering” from 2010 through last month:
Ironically, as a long-time proponent of the marketing data warehouse, I recently found myself making the decision to connect an app I was building to APIs to get GA, GSC and other data sources, even though I had access to more or less the same data in BigQuery!
I didn’t think too hard about it, I just did it. Later, when I asked myself why, I thought of an interesting analog.
There was a time when manufacturers treated inventory like an asset. Having lots of widgets on the shelves meant uninterrupted production, and the widgets themselves had value, right?
Wrong. Companies that embraced just-in-time inventory management proved that inventory was a cost center, not an asset. Every day a widget sits on a shelf, it loses value due to the myriad costs involved in keeping it on the shelf.
As I was building my app, e.g. actually doing something with data, I intuitively gravitated towards a just-in-time approach. Yes, I might have the data I need in a warehouse, but I was more confident that I could get it where I needed it when I needed it from an API.
As I said, it was an intuitive rather than considered decision, and I’m not going to reverse my POV on data storage just yet. Real-time access to data via an API has its limitations, too. Many platforms limit historical data access, and anyone who has dealt with chart lag and errors on a bloated Looker Studio dashboard knows the benefits of data stored in BigQuery. Just-in-time inventory management can be more nimble and cost less, but it is also more brittle. Just ask any JIT manufacturer who lived through the pandemic.
On the other hand, I believe that I have been underestimating the costs and overestimating the benefits of storing everything all the time. Stored data is not an asset, it is a cost center. It is only when you do something with data that value is created.
From now on, when faced with a business need that requires data, I will be asking myself, “can it be solved with an API, or does it require storing data in a warehouse?”
Product Updates
- Google Search Console: Branded query filter
Anyone who spends time analyzing query data is used to sorting and filtering based on branded versus non-branded. Generally, marketers view branded search volume as a corollary of pre-existing brand interest, while getting clicks from non-branded terms is potentially creating interest. Many of us have been creating complicated regular expression filters to differentiate branded from non-branded. This GSC update saves us a bit of trouble, and hopefully does a better job. - Google introduced a new user agent for AI-user-initiated website crawls. This matters for tracking and analytics because it gives us a little bit more visibility into how our website content is being consumed by users of AI. So far it isn’t being used for Google AI Mode interactions as far as I can tell, but hopefully that will change.
Marie Haynes does a nice job of explaining the significance of this smallish change in a larger context: Why Google’s New “Google-Agent” is the Biggest Mindset Shift in SEO History - Meta Advertising: has made a significant update to how click-through conversions are calculated. Previously, they counted engagements such as likes and comments as ‘clicks’. Now they are only counting clicks as clicks, and have created a new conversion type, ‘engage-through’ conversions. One impact of this is that you will likely see a drop in click-through conversions and conversion rate. You may want to provide stakeholders with an engage-through + click-through metric for a few months, for the sake of apples-to-apples comparison. In the long run, this gives you better visibility into how your social marketing influences buyer decisions, which is a positive change.
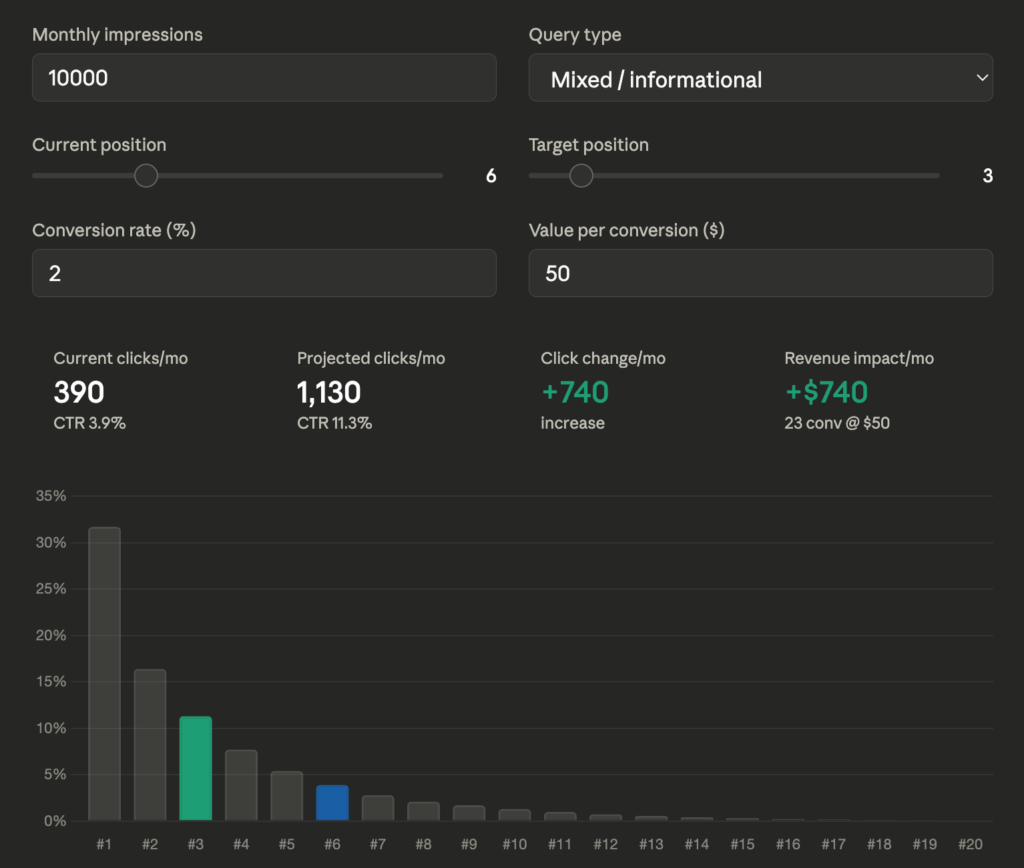
- Claude: interactive visuals – there are way too many AI-platform updates to keep track of here, but this one is pretty relevant to analytics. Claude can now provide an interactive visual tool as part of a response. I tested it out with a request, “Can you create an interactive visualization so I can forecast the impact of a ranking change in Google Organic Search, based on differences in click through rates by position?” It produced this lovely, interactive tool:
AI-assisted Analysis
- Vibe Analysis – Part 1, Arslan Aziz, PhD
This is the first article in a five-part series where the author, an experienced data scientist, describes his methods and philosophy of ‘AI-assisted’ vs. ‘AI-led’ analysis. I found the structure of his approach really helpful, and the series includes some specific, ‘how-to’ recommendations that I’ve started implementing. But don’t think that you will become a data scientist just by following his advice. A throughline is that you need to understand data science methods well enough to know when the LLM gets it wrong.
The whole series can be found here. - The death of SaaS analytics: your stack is dying, here’s what replaces it, Steven Elliot, Measurelab
A data-platform-oriented take on the SaaS apocalypse. He makes the argument that you can probably get rid of a chunk of costly software subscriptions and do most of what you want to do with BigQuery and open-source tools. I generally agree, and I really appreciate that BigQuery costs are based on usage, not subscription fees. Some argue that’s the pricing model of the future. Here’s hoping. - BigQuery Just Gave Your Data a Voice: 6 Conversational Analytics Updates That Change Everything, Ravish Garg, Google Cloud
BigQuery introduced data agents a few months ago. I gave the feature a quick look then, but found it pretty clunky. They’ve made some improvements and it’s starting to shape up into a useful tool. I wrote a post describing my experience with it here. For another perspective, check out this article from Gunnar Griese.
Workflow
- Top 10 Google Chrome extensions for Google Tag Manager, Julius Federovicius
Useful tools to improve the Tag Assistant UX, troubleshoot the dataLayer, and verify that tags are firing with the right data. There’s a fair bit of overlap between some of the extensions, so this is more like “everything Julius could think of” than “everything you should install”. - Dataform for GA4: Build Your First BigQuery Transformation Pipeline, Paolo Bietolini
Excellent, step-by-step instructions for working with GA4 export data in Dataform with lots of code samples.
Tracking & Attribution
- Triangulated attribution: using rules to eliminate biases in click-based MTA, Barbara Galiza
I have tended to frame attribution as a choice between observed (MTA) and inferred (MMM/incrementality). Both have significant limitations: the former inherently favors what is easiest to measure; and the latter operates at 10,000 feet, while most of the marketing decisions we make are on the ground. This article describes methods for using inference and qualitative data to ‘triangulate’ a better form of MTA. Sneaky smart.
Reporting & Visualization
- Data Graphics Need a Memory, RJ Andrews
A bio piece about Michael Friendly, a leading historian and practitioner of data visualization. I’m mostly including here because of the references to Milestones – a fascinating timeline of advances in visualization.
Miscellaneous
- What Google’s New Universal Commerce Protocol (UCP) Means for Marketers, Kurtis Nysmith, John Williams, Seer Interactive
- This article is more about ecommerce than tracking, but it is another example of how behavior is shifting in ways that have significant implications for measurement. I also think ecommerce is just the first step – it is inevitable that lead forms, donation systems, scheduling tools and everything else that represents a conversion will follow suit.