Top-level Navigation
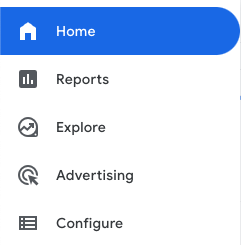
Like some other things in GA4, the top-level navigation is a bit perplexing. Reports seems like the obvious place to go for your reporting needs, but you can also view reports under Explore and Advertising. Google also recently moved Configure features to Admin, so really, the navigation amounts to
- Home (overview report)
- Reports
- More reports
- Even more reports
I can’t fathom why Google put some reports under Reports, and others under Advertising, but the Explore section of reporting is actually a bit different. We will cover explorations in detail later, but in summary, they are more geared towards exploring data versus reporting on data. For example, there is a ‘Path exploration’ option, which shows how users move through a site. It is kind of useful for that, but actually pretty terrible at generating reports for sharing. On the whole, I have found that customizing or creating new reports in GA4 or creating a Looker Studio dashboard are better options for sharing data with other people, while explorations are useful as more of a scratch-pad while I’m doing analysis.
The Search Bar Is Your Friend
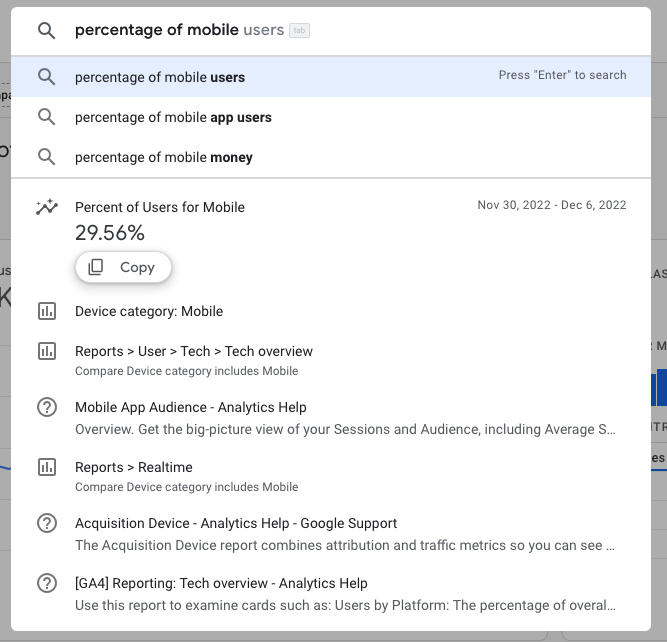
If you’re not sure where to find something, the search bar at the top can handle a variety of natural-language questions and point you to what you are looking for. If you are looking for a specific metric, it will often show up right there as you are typing your query. For example, try typing “percentage of mobile users”. You can see to the right that it gave me the percentage without having to click on anything.
I personally do not find the reporting navigation very intuitive and have found the search bar very helpful for getting to know where to find different types of reports.
Getting Help
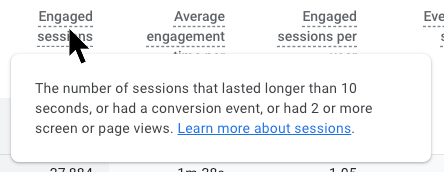
There is also contextual help all over the place. The help button in the top bar will bring up links to help articles related to the report you are viewing.
And if you mouse over any dimension or metric in a report, a tooltip will pop up with a summary definition.
On the whole, I find Google’s help to be hit-or-miss. I typically do a Google search and look for other resources instead of going straight to Google’s documentation. I also tend to look for one of the following sites in the results:
- analyticsmania.com – Julius Fedorovicius, the man behind analyticsmania.com, provides exhaustive detail on how GA4 works, and generally keeps his articles up-to-date, which is important because GA4 has been changing a lot. Sometimes I narrow my search to just his site – you can do this by typing “site:analyticsmania.com GA4 events” into the Google search bar.
- simoahava.com – especially great for anything related to Google Tag Manager
- lovesdata.com – Loves Data is a good place to start when you are learning. The site is run by Benjamin Mangold, and I recommend his GA4 course to anyone starting out. He also has individual articles and videos covering most Google Analytics topics.
- stackoverflow.com – Stack Overflow is where pretty much everyone in the software development world goes to ask and answer questions. The questions and answers tend to be pretty technical, but depending on your learning style, you might like the dialogue that takes place in answers and comments. I do.