A Reporting Demo & Key Concepts
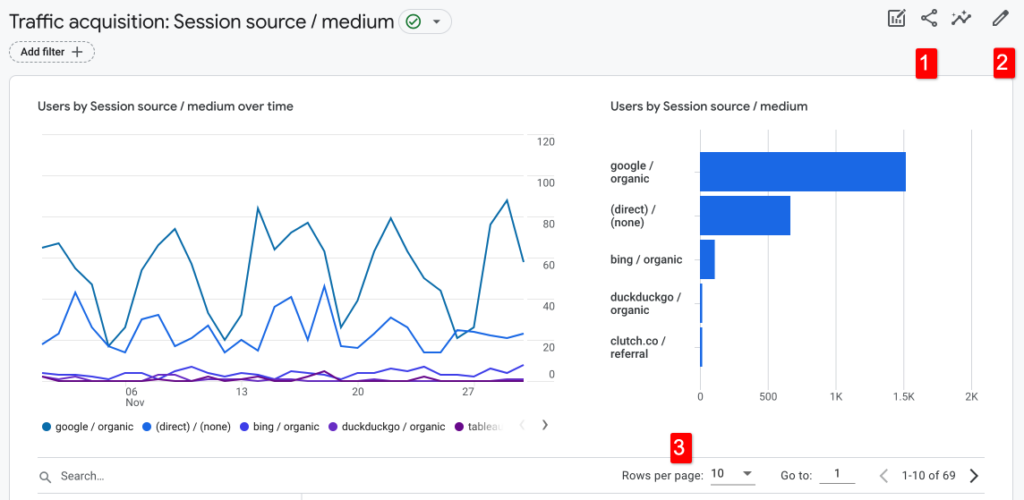
As a quick overview of reporting in GA and key concepts, we will do a detailed walkthrough of the Traffic acquisition report.
This report shows performance summaries for traffic by various dimensions. This, along with the User acquisition report, is a good place to start when you are trying to understand marketing performance for a site.
The difference between the Traffic acquisition and User acquisition reports is that the former shows metrics that are aggregated by session, while the latter aggregates by user.
You can think of a session as akin to a visit. If a user visits a site 3 times in a month, and you run a report for that month, that user will account for 3 sessions. Technically speaking, a new session starts when a user has been inactive on a site for at least 30 minutes. So if you visit a site in the morning and the afternoon, with a hour-long lunch break in between, you will count as two sessions. Conversely, if you stay active on a site over the course of a day or even multiple days, with no 30 minute breaks in activity, you will count as a single session.
In contrast to sessions, the dimensions in the User acquisition report show how a user got to the site the first time they visited.
The Google Analytics Demo Account
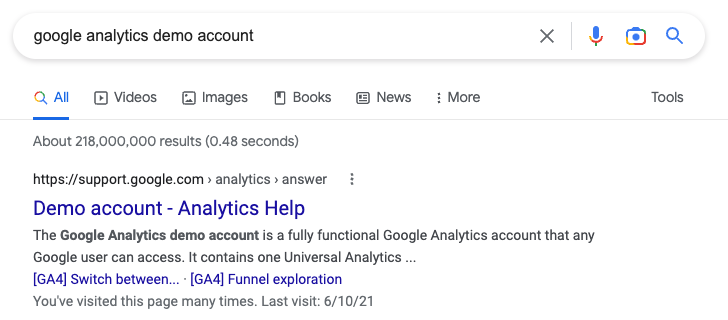
If you would like to follow along but don’t have access to a GA4 account, Google has several demo accounts that anyone can view. To see them, search ‘google analytics demo account’ and click on the first result.
Dimensions & Metrics
Every report in GA has a primary dimension and multiple metrics that relate to that dimension. A dimension is a unique attribute of a session or user. An example of a dimension in the Traffic acquisition report is Session default channel group.
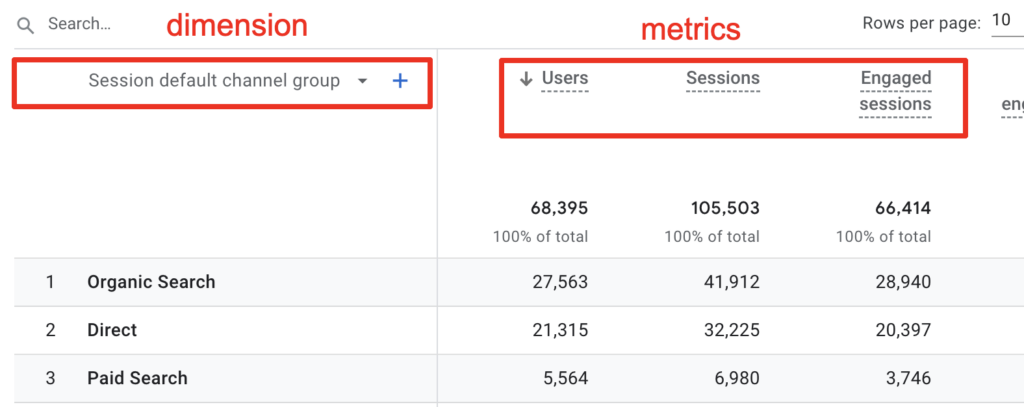
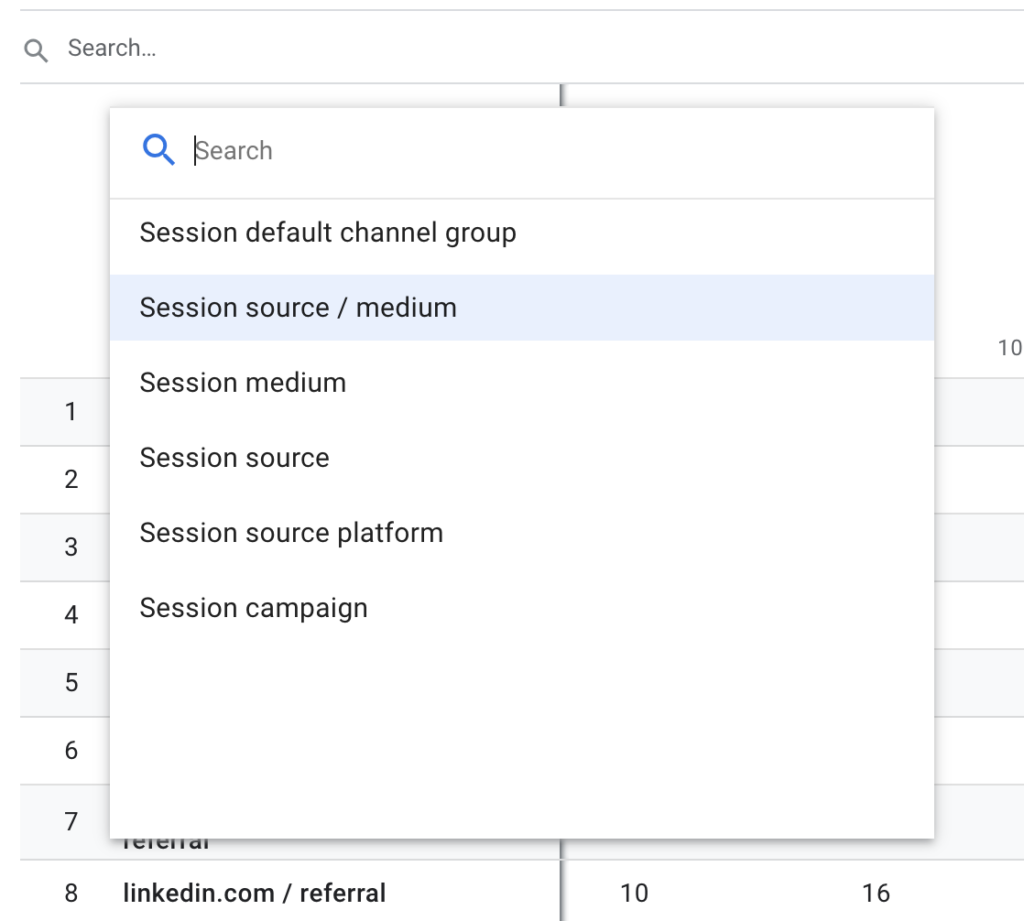
If you click on the arrow to the right of the dimension, a dropdown menu will pop up that shows you all of the dimensions you can select for the report.
Conversions
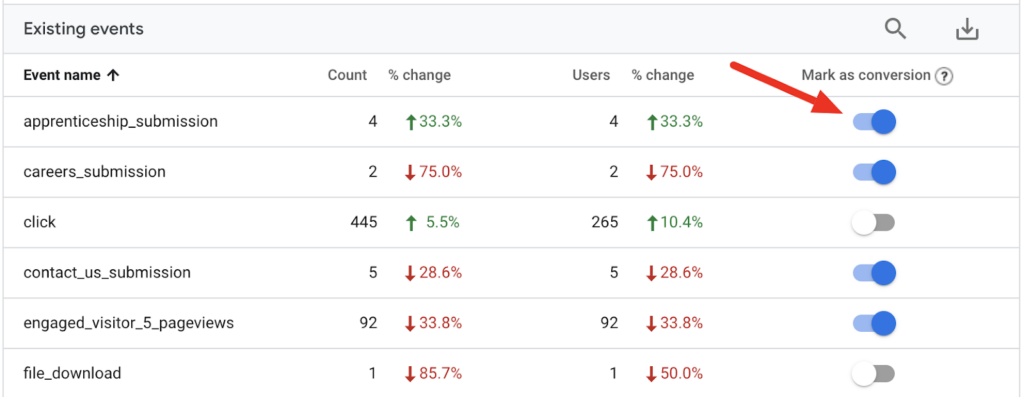
Any event in GA4 can be a conversion. To designate that an event is a conversion, you just need to go to Admin (the gear icon in the lower-right) > Events and select the ‘Mark as conversion’ toggle to the right of the event. You can also go to Admin > Conversions and select ‘New conversion event’, but you need to make sure that the name you enter exactly matches the event name if you do it this way. I prefer to do it the first way so there’s no chance of error. Note that new events can take as much as a day to show up under Events, so if you create a new event you’ll have to either wait for it to show up under Events to flag it as a conversion, or use the ‘New conversion event’ method instead.
You will likely run into circumstances where you only want an event to be a conversion if it matches certain criteria. For example, you may consider a contact us form submission to be a conversion, but not a job application form submission. form_submit is an automatically tracked event, but this is a catch-all for form submits. If you only want some form submits to be conversions, you will need to create separate events for each type of form. Here is some Google help on creating new events based on specific event parameters if you’d like to learn more.
Conversions show up in most reports as a column, and you can click the down arrow to the right of ‘All events’ to select a specific conversion event. Unfortunately, individual conversion events are not available as separate metrics like they were in Universal Analytics. Conversion rate is also not included in most reports, though both user and session conversion rate do exist as metrics in GA4.
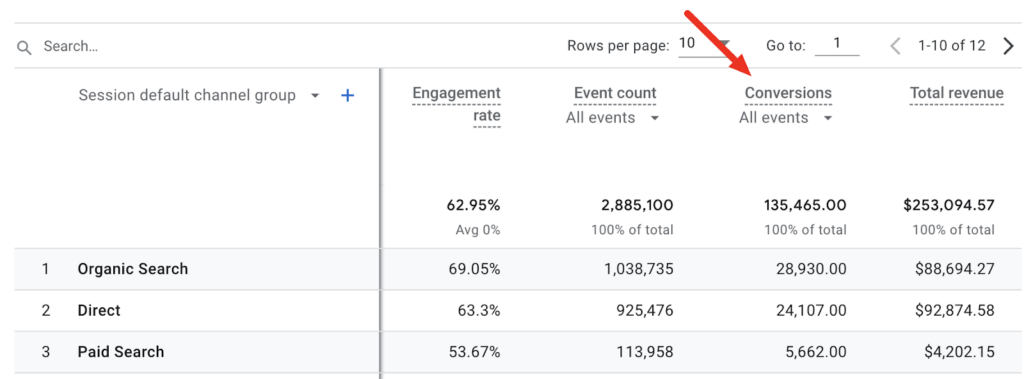
In the Traffic acquisition report, conversions are attributed to the dimension applied, i.e. ‘Session default channel group’, ‘Session source / medium’, etc. For example, if a visitor arrived at the site by clicking on an organic search listing, then completed a purchase, the purchase conversion would be counted in the ‘Organic Search’ row. That same conversion might be counted differently in the User acquisition report, for example if the visitor previously visited the site by clicking on a Facebook post. The User acquisition report attributes conversions to the channel / source they came from the first time they visited the site, sort of. I say “sort of” because GA4 doesn’t actually track users. It does the best it can to identify users based on various characteristics, but will often count a single person as multiple users if that person visits using different devices or browsers.
In short, take User acquisition with a grain of salt.
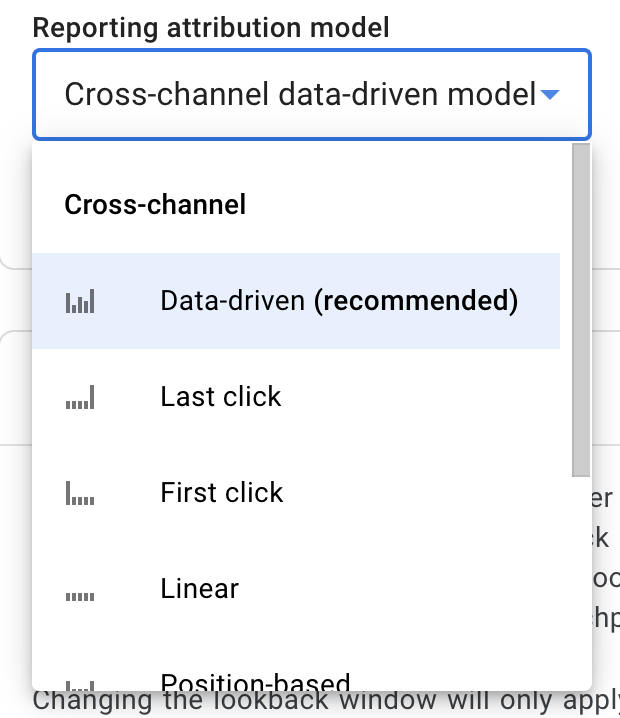
To make matters a bit more complicated, by default GA4 uses a different model to attribute conversions in most reports other than User and Traffic acquisition. The default attribution model in GA4 is Data-driven, which means that it uses machine learning to share attribution among multiple sources if a user visits multiple times before completing a conversion. We’ll get into this more later, but overall it does make sense even if it is a bit confusing. If I want to know how people first got to the site and whether or not they converted over time, I go to the User acquisition report. If I want to know how people get to the site for a given visit, I look at the Traffic acquisition report. If I want to see how different factors combine to influence conversions, I can see that too, in particular under the Advertising section of reporting. Ok, maybe “makes sense” is a bit strong – let’s just say there is a logic behind Google’s choices, even if they are a bit opaque to the user.
Comparisons
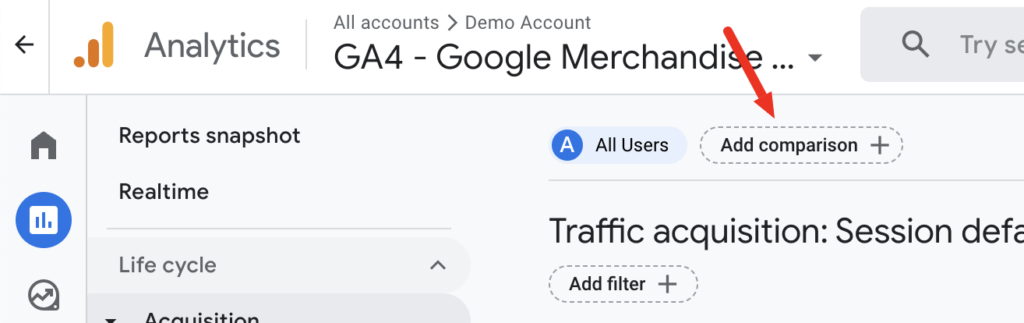
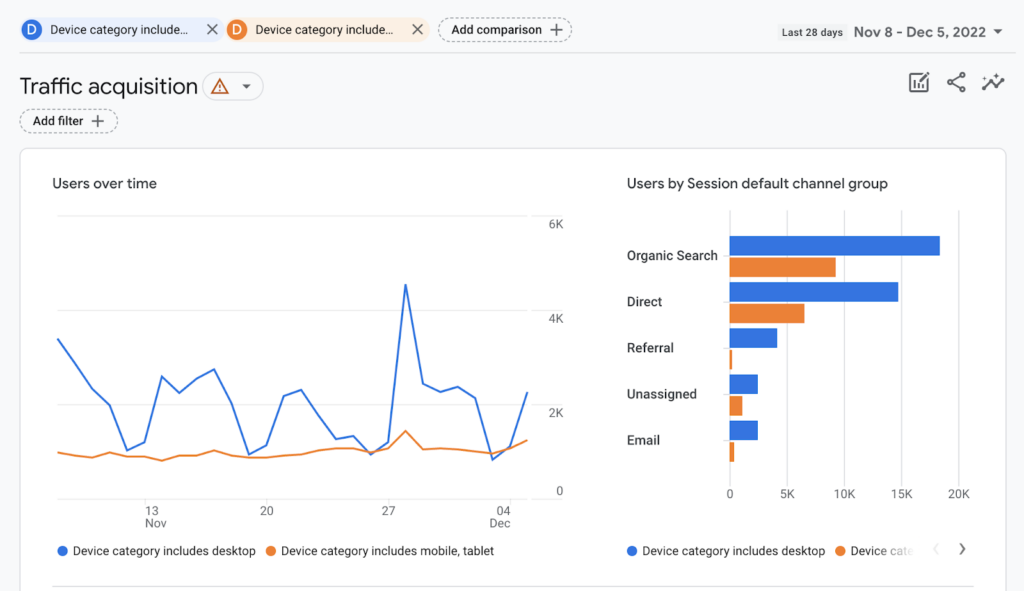
You can apply comparisons to reports to compare the performance of different user or session characteristics. For example, you can compare organic vs. paid search traffic, or the behavior of mobile versus desktop visitors.
Below is an example of the Traffic acquisition report with comparisons added to look at the performance of mobile versus desktop traffic. Comparisons persist from report to report when you are using GA4, but if you leave reporting and come back, you will need to recreate your comparisons.
Tip: if you can’t get a comparison to do what you want, try creating an audience, then create a comparison and select ‘Audience name’ as your dimension, then specify your audience.
Filters
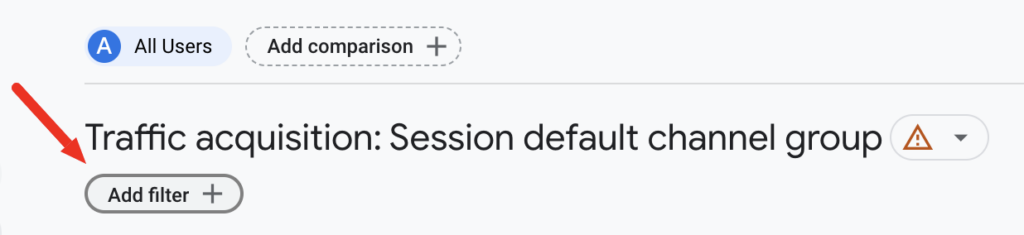
Filters do essentially the same thing as comparisons, just without the compare part. You can apply a filter, for example, if you just want to look at desktop traffic or organic visitors.
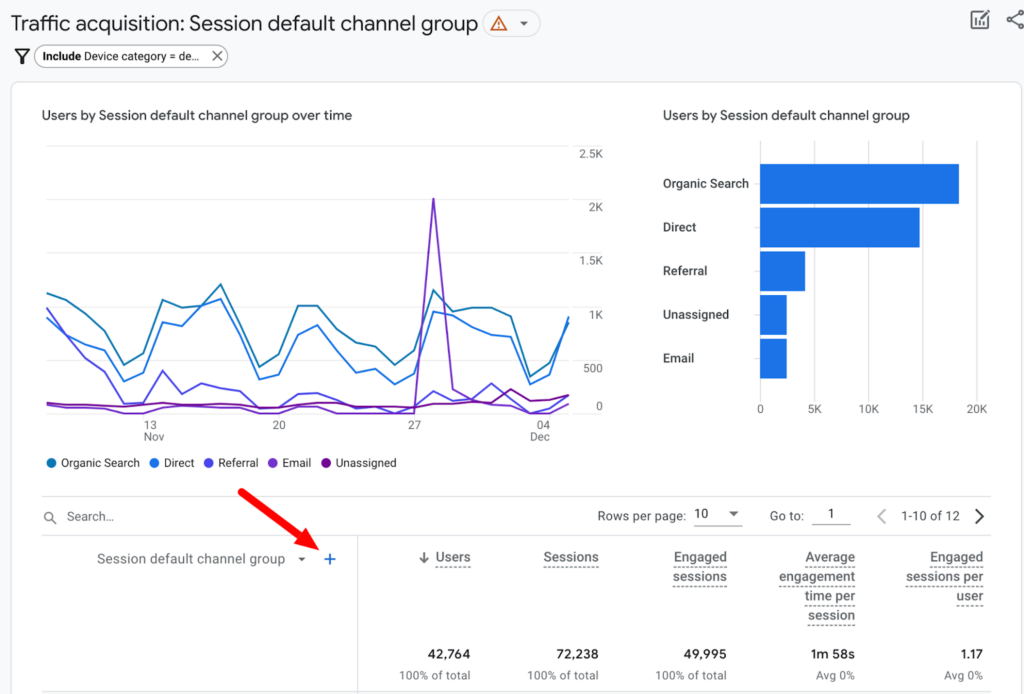
Secondary Dimensions
Secondary dimensions are one of the most hidden and useful features of reporting. If you click the plus sign to the right of your primary dimension, you can add a second dimension to your report. Unlike the primary dimension dropdown, you can pick from all of the dimensions available in GA4, as long as they are compatible with your primary dimension.
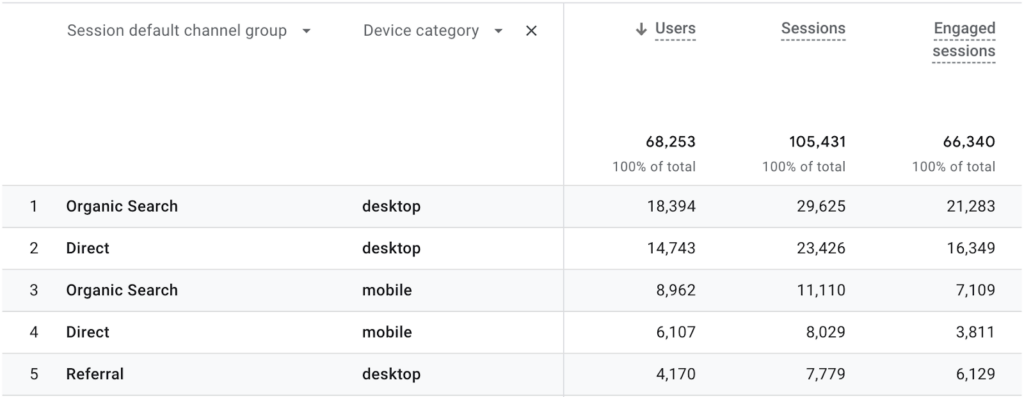
In the example below, ‘Device category’ has been added as a secondary dimension to the Traffic acquisition report.
UTM Parameters
UTM parameters give you the ability to specify source, medium and other traffic attributes when you create ads on platforms such as Facebook and LinkedIn, or when you link to your site from a blog post, email, directory listing or other referring page. Note that Google Analytics will generally do an ok job of identifying the source and medium of a visit on its own, but you may want to override what Google is able to infer from the referring domain. A good example of this is email – if you send out an email newsletter with links to your site, the source will show up as whatever platform the recipient uses for email, e.g. Gmail, Outlook, etc. You will get a better view of marketing impact if you override the source and medium with “newsletter” and “email”, for example.
To apply UTM parameters, you append them to the URL linking to your site. We will go into UTM parameters in more detail later, but check out this free Google tool to see all of the parameters GA supports and construct your own URLs with parameters.
Example: twooctobers.com/?utm_source=awesome&utm_medium=sauce
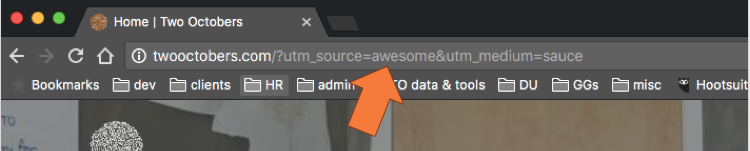
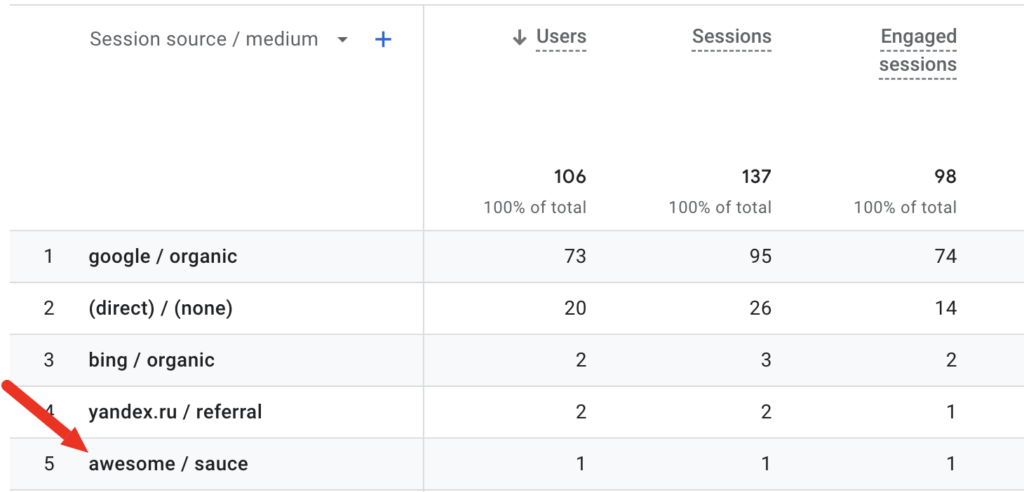
You can see below that by putting those parameters in the URL, I now see a visit with source = awesome and medium = sauce. Voilá!
UTM parameters only work in cases where you have control over the link pointing to your site, which you do with paid advertising campaigns, for example, but you do not when someone you don’t know adds a link to your site in a social post.
A few more reporting features and capabilities
The screenshot below shows where to access each of these features.
- Downloading – click the ‘Share this report’ button and you will be able to download a report as a PDF or CSV file. Note that you need to have at least Viewer permissions to see this option.
- Customizing – a powerful feature of GA4 is that you can customize any report, as long as you have Editor or Administrator permissions. Customizing allows you to change the dimensions and metrics that appear in a report, and the types of graphs used. Customizing reports changes the interface for all users, so I recommend that you only customize if you are very confident in your GA skills and understand the needs of all users.
- Pagination – GA only shows the first 10 rows by default. You can increase the number of rows or tab between pages to see more. Unfortunately, increasing the number of rows is a temporary change. GA will revert back to 10 rows when you look at another report.