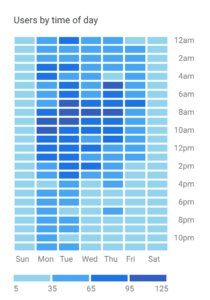
Reporting on website traffic by time of day and day of week is a useful way of understanding the behavior of a website’s audience. We loved the visualization at the right, from Google Analytics’ Universal Analytics home screen, but there isn’t a similar view in GA4.
In this blog, we’ll show how to see hour-of-day data in a GA4 Exploration, and then move to Looker Studio to produce a line chart of sessions by hour and finally a heat map table of sessions by time of day and day of week that looks pretty close to the old UA table.
If you’re more of a show-me kind-of-person, the video below takes you through the same steps as the blog.
How to Report by Time of Day in GA4 with Explorations
Explorations is the best way to view time of day data in GA4. In fact, in GA4’s Reports section, the few times Date + hour is available as a secondary dimension, the resulting table is pretty hard to get useful information from.
An Exploration is quick to create and useful for understanding things like impact of a press release that happened at a specific time a few days ago. However remember that GA4 does not process data real time, so it won’t show you traffic for today.
- In GA4, navigate to Explorations.
- Create a new exploration.
- In the Settings panel, in the Visualization section, click on the line chart.
- In the Variables panel, in the Metrics section, add Sessions. Then drag it into the Values section in the Settings panel.
- In the Settings panel, in the Granularity section, select Hour.
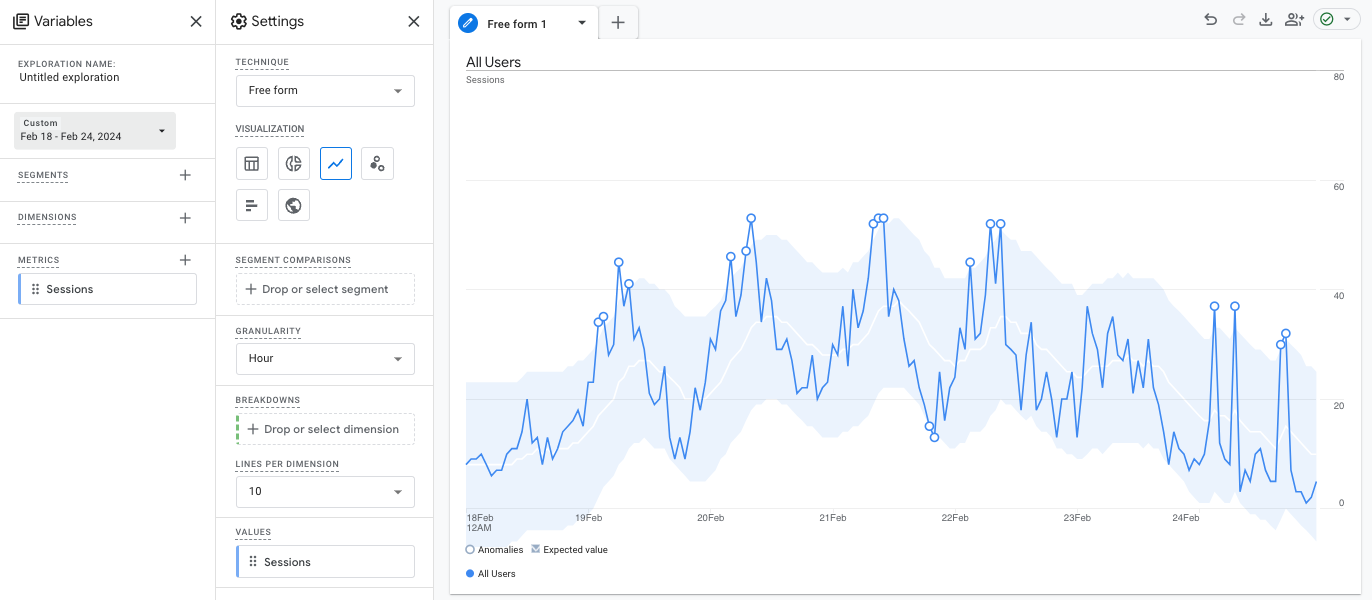
You’ve created a simple chart showing the variation of sessions each hour across the days you’ve selected. Shorten your time period to see the data a little better. The lighter blue area shows GA4’s expected values for session volume based on historical performance, and the dark blue line shows the actual values.
Charts and graphs in Explorations have very limited options for formatting and presentation, so unfortunately it is not possible to create a visualization that incorporates both time of day and day of week inside of GA4.
Report on Time-of-Day Data GA4 Looker Studio
Looker Studio gives us much more power for configuring the appearance of tables and charts, so we often use it to create more meaningful visualizations of GA4 data.
GA4 Date and Time Dimensions Available in Looker Studio
Looker Studio includes several time-related dimensions from GA4 that you might use for this type of report: Date, Hour, Date + hour, Date hour and minute, and Day of week name.
If you don’t see these dimensions in an existing Looker Studio report, you may need to update your data source. When Google Analytics introduces new metrics to the Looker Studio connector, they don’t automatically start being available for previously connected data sources. Go to Resources > Manage added data sources, select your GA4 data source, and click Refresh Fields at the bottom of that screen.
Create a Timeline Chart of Sessions Across Days and Hours
- On a Looker Studio page, add a Time series chart. Confirm that it’s using the correct GA4 data source.
- The default Dimension selected is Date. Change it to Date + hour. You’ll notice that the chart doesn’t change at all. That’s because you need to make a settings change to that dimension.
- Click the edit button to the left of the selected Date + Hour dimension.
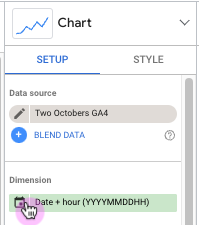
- Select Data Type, and navigate to Date & Time and select Date Hour. Close the window.
- Change the Metric to Sessions.
- You may want to change your date range to a shorter range to see the data more clearly. To do that, Insert a Date range control and shorten your timeframe to a week.
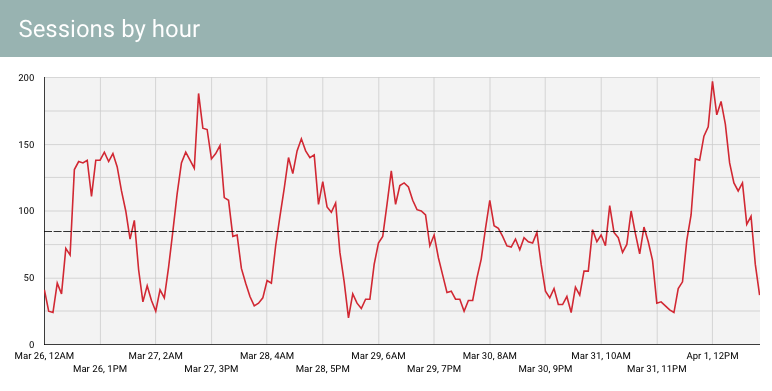
- To make the chart more useful, let’s add a line showing the average sessions per day. In the Chart panel, on the Style tab, click Add a reference line.
- Change the Type to Metric. The default metric selected should be Sessions, and the Calculation set to Average. This will add a line on your chart showing the average sessions per hour, so you can easily see which day+hour fall above or below the typical volume. Change the Label of the reference line to “Average sessions” to make it a little clearer what that line is.
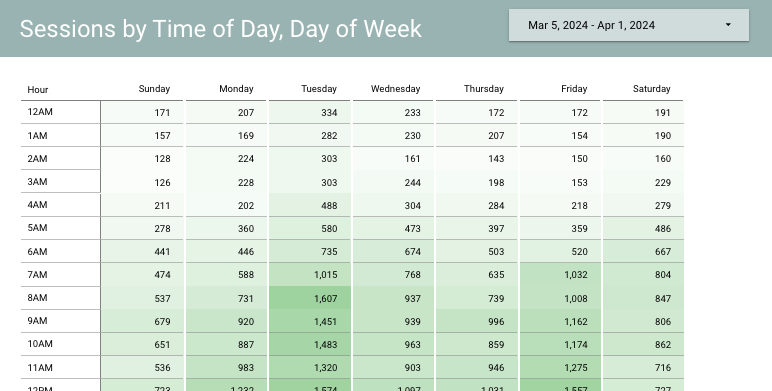
Create a Heatmap Visualizing Website Sessions by Day and Hour of Day
A color-shaded table of data by day of week and hour of day is a great way to quickly understand trends. And it’s pretty straightforward to create in Looker Studio.
- On a Looker Studio page, insert a Pivot table with heatmap. Confirm that it’s using the correct GA4 data source.
- Under Row dimension, select Hour.
- Under Column dimension, select Date. Then click edit to the left of Date and change the Data Type to Date & Time > Day of Week.
Note: You might be tempted to select Day of week name for the column dimension. But that won’t work here, because you won’t be able to get your columns sorted in day-of-week order–your sort options are limited to alphabetical ascending or descending. - Under Metric, select Sessions.
- Adjust the sorting. For Row #1, select Hour and Ascending. For Column #1, select Date (Day of Week) and Ascending.
- You may need to make your chart larger to show all the columns and rows.
Deeper Analysis
This type of chart is a good way to understand when users are visiting the website. And you can use it with other types of metrics as well, for example conversions, engaged users, or a calculated field for percentage of engaged users. Consider comparing one segment against another. How does the heat map of sessions compare to the heat map of conversions? Where do they correspond? Where do they differ?
A bonus suggestion based on a question from one of our YouTube viewers: Can you see this just for one page on a website? Yes! Add a dropdown control with Page path as the dimension, and select one or more pages to analyze.
You can also add a dropdown control to filter the data by traffic source.
How to Use Time-of-Day Website Data
How would you act on this data? Here’s an example.
It’s a fairly common pattern on ecommerce websites to see spikes in activity at lunchtime and in the evening. When we compare the number of sessions to conversion rates, we might find that people are looking in the evening, and buying at lunchtime. That’s valuable information for paid media–it tells us that even if the visits to the website in the evening aren’t converting in that same session, they may be coming back the next day to do the purchasing. I might want to serve ads that appeal to product discovery in the evening.
What could you explore and uncover through analysis of time-of-day patterns?

At Two Octobers, we build Looker Studio dashboards for marketing teams of all sizes, as well as solve tricky tracking and integration issues to help marketers leverage data to make better decisions and improve performance.
Be sure to check out our other tutorials for GA4 and GA4 in Looker Studio. And reach out if you’re interested in customized one-on-one training to improve the marketing analytics practice at your business.