Running a great SEO program means leveraging lots of data. We find it helpful to have a good dashboard to help make sense of all that data. We tend to use dashboards for two purposes: 1) exploration and analysis, and 2) reporting for stakeholders.
These are five of our favorite SEO dashboards for analysis and reporting. They’re all based in Looker Studio, a free Google tool. As a plus, with some understanding of Looker Studio, you can customize any of these reports to brand it for your organization and feature only the data that works for you.
1. Hannah Rampton’s Search Console Explorer Studio
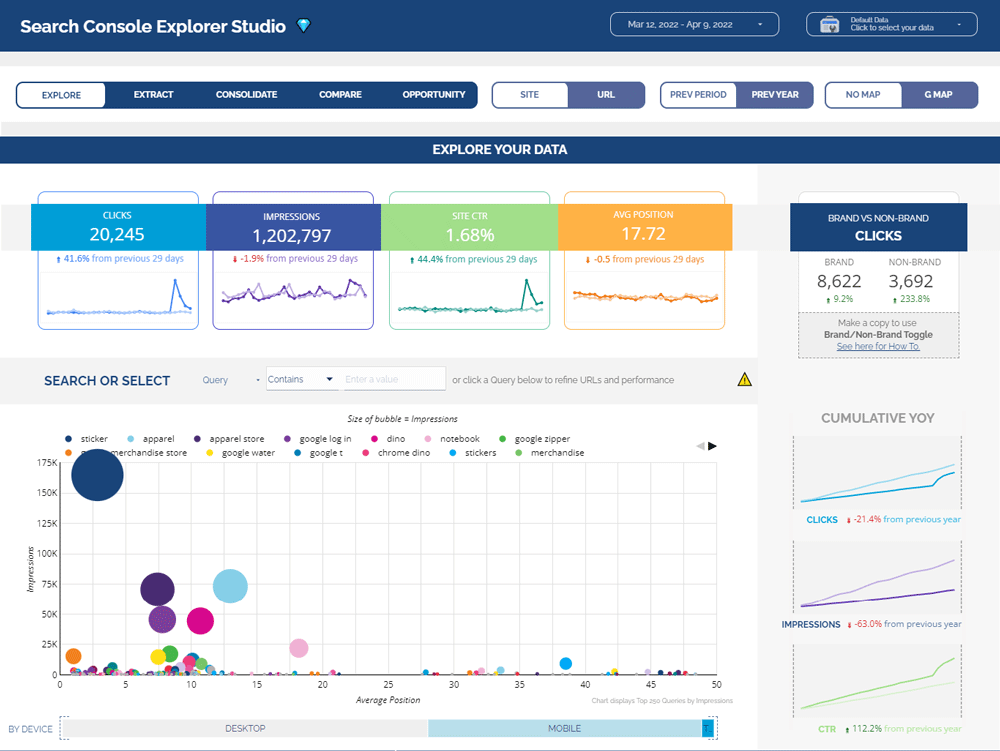
A popular Google Data Studio dashboard that offers comprehensive exploration and analysis of Google Search Console data. Includes embedded help guides and enhanced functionality for data exploration and export.
Key features:
- Advanced data exploration with toggleable comparison and aggregation options
- Keyword cannibalization detection with interactive cross-filtering
- Built-in tools for generating REGEX and CASE statements
- Unlimited data export capability, bypassing the typical 1k row limit
- Side-by-side performance comparisons with flexible time period options
2. Semrush Looker Studio Templates
A collection of three specialized templates from Semrush, each designed to address different aspects of SEO analysis and reporting. These templates work together to provide a comprehensive view of SEO performance for your domain, or a competitor’s domain. You do need to have an Semrush subscription to access this data.
The Position Tracking report monitors keyword rankings and visibility, with one tab focused on your domain and a second comparing performance versus competitors you select.
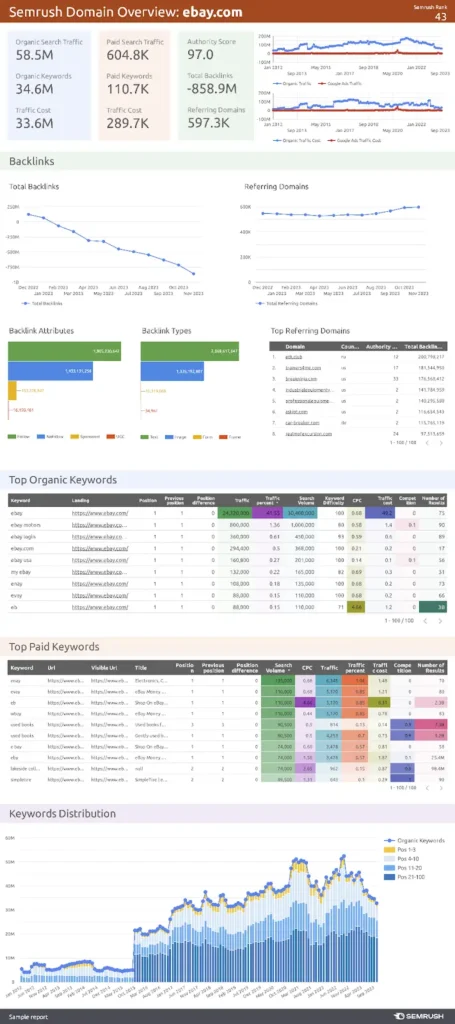
The Domain Analytics report is a comprehensive look at traffic, keywords, backlinks, referring domains, and keyword position ranking distribution.
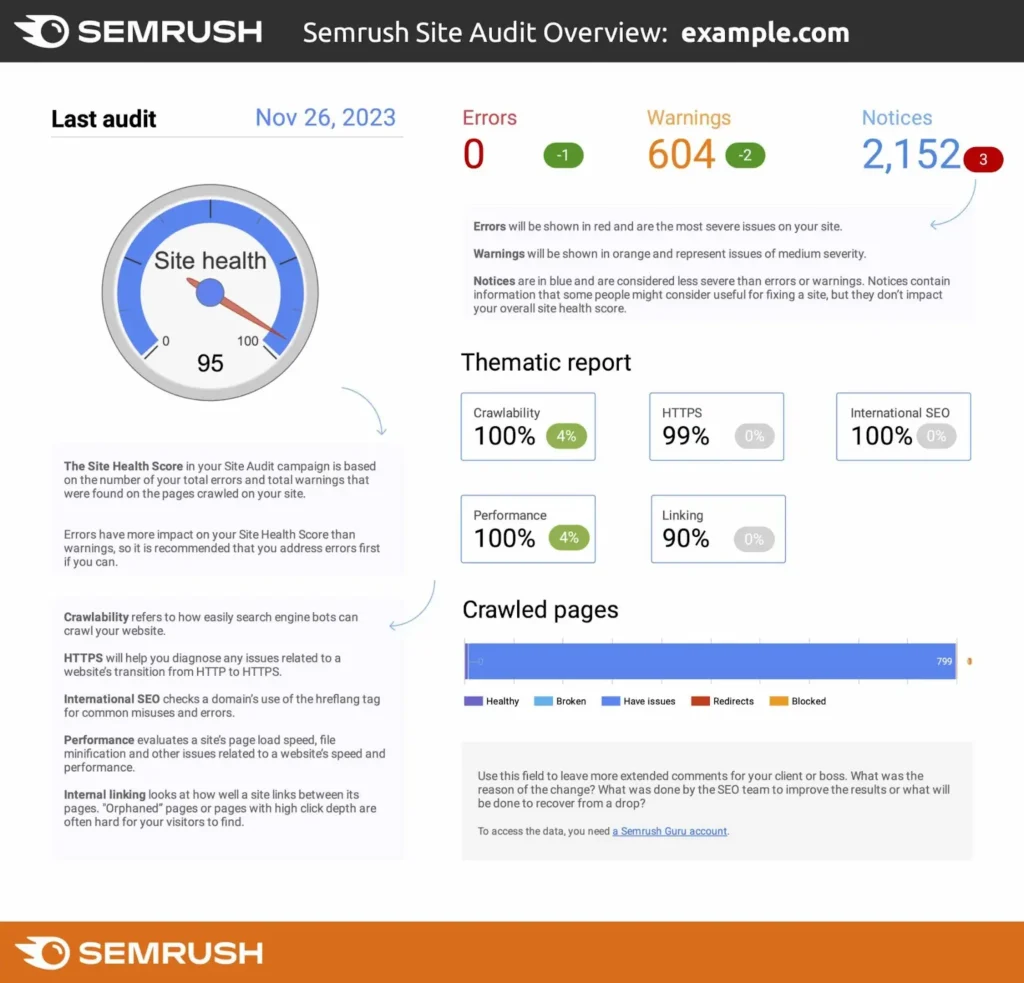
The Site Audit report provides insight into a domain’s technical SEO issues.
3. Dominic Woodman’s Search Console Report
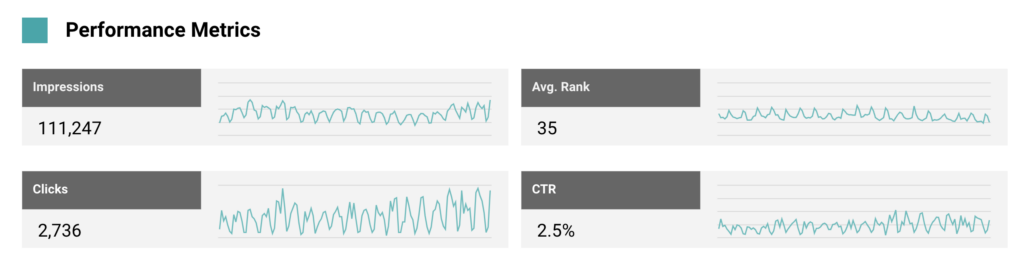
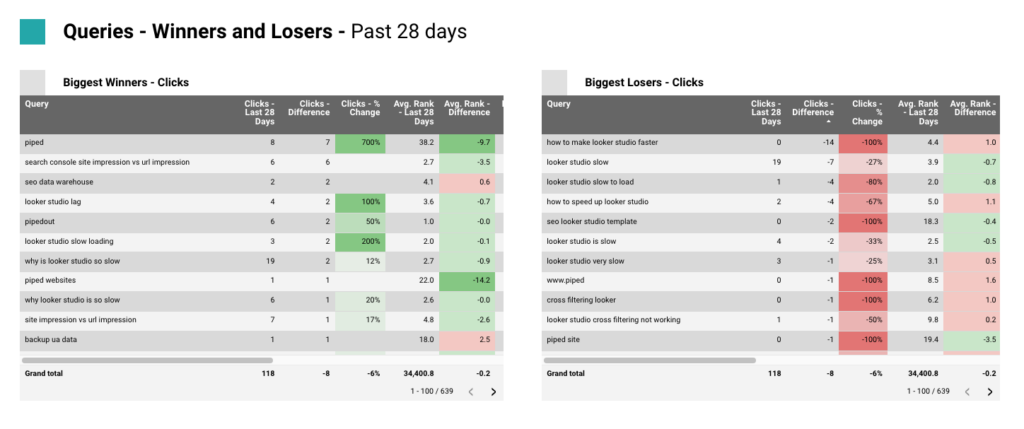
A customizable dashboard template focused on deeper analysis and reporting of Search Console data, designed to go beyond the basic interface that Google provides.
Key features:
- Dual layouts for both over-time analysis and period comparisons
- Detailed breakdown of average rank into more meaningful metrics
- Dimension-driven traffic analysis for deeper insights
- Built-in tracking against custom targets using Google Sheets integration
4. Branch Explorer
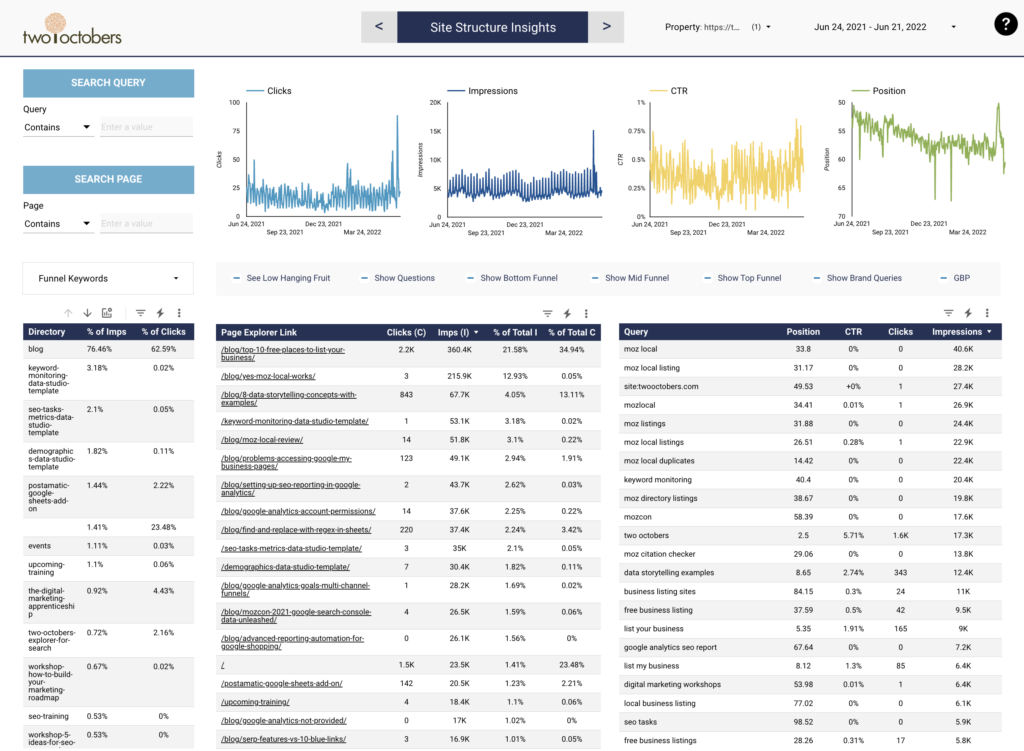
This paid dashboard offers more expansive analysis of Google Search Console data to uncover opportunities and narrow in on problem areas.
Key features:
- A data pipeline that stores GSC data in Google BigQuery, so you have more historical data than GSC keeps.
- Customized keyword tagging, so you can filter by brand/non-brand and place in the funnel.
- BigQuery data source means faster filtering and analysis than dashboards leveraging the API.
5. Google’s Chrome UX Report (CrUX) Dashboard
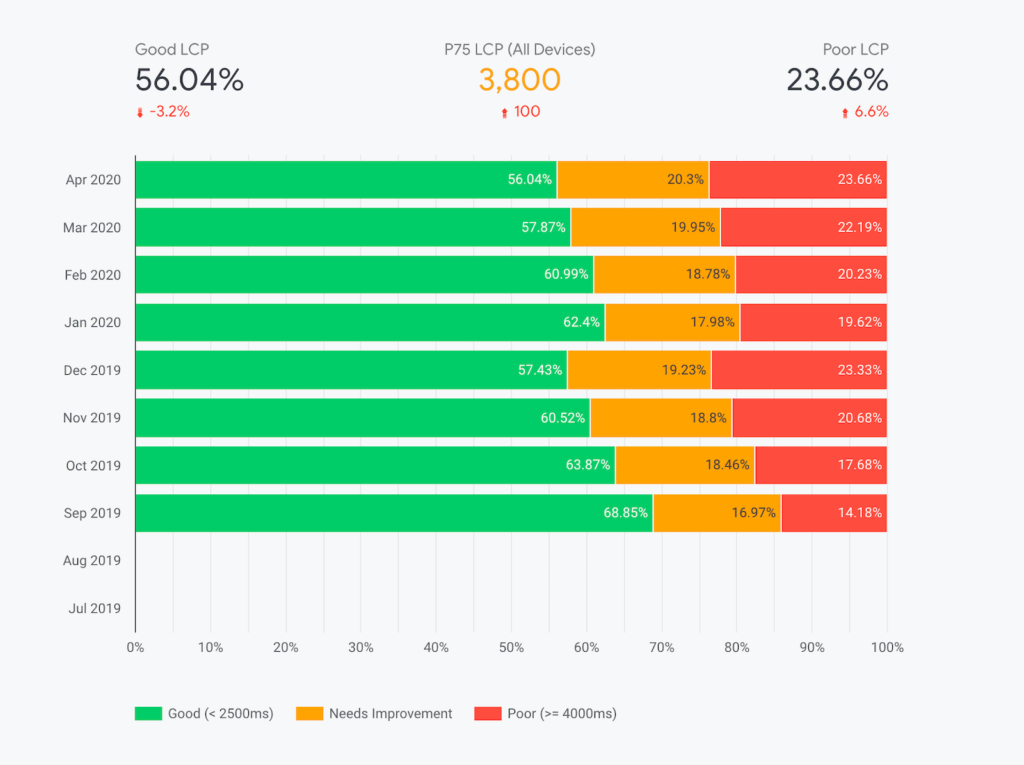
This dashboard focuses on user experience metrics that Google’s Chrome team collects on domains, in a public data set in Google BigQuery. This tool is maintained by the CrUX team and automatically updated with new metrics. It’s great for understanding key usability data about your domain and tracking it over time.
Three reports:
- Core Web Vitals, showing current mobile and desktop performance.
- Metric Performance, a view of Core Web Vitals performance over the past year.
- User Demographics, which shows how many mobile vs. desktop pages were rendered for the domain, as well as the connection types (4G, 3G, 2G, etc.) used to access the domain.

We’d love to hear about other Looker Studio dashboards you’ve found useful for SEO analysis & reporting. Add your thoughts in the comments below.
As you explore and adapt these templates to your needs, remember that mastering Looker Studio can take time—but the insights you’ll gain are worth the effort. Need some guidance along the way? Check out our Looker Studio for SEO training series on Youtube, or reach out to our team for personalized support. From troubleshooting to building custom dashboards tailored to your unique requirements, we’re here to help you transform your SEO data into actionable insights that drive results.

Here’s another nice one from Aleyda Solis.