Most of what happens when your website gets mentioned in an LLM is invisible. We can measure the click when a user follows a link — but clicking links isn’t the primary mode of interaction in these interfaces. And the tools that promise to fill the gap — submitting simulated prompts and checking whether you appear — are measuring their own queries, not real users asking real questions.
Enter AI user bot monitoring.
What Are AI User Bots?
When a user asks Claude, ChatGPT, or Perplexity a question that requires current information, the model often fetches content from the web in real time. It sends out a server-side request to retrieve the page, then incorporates what it finds into its answer. These requests are made by bots operating on behalf of the user — hence the user agent strings Claude-User, ChatGPT-User, and Perplexity-User.
These are distinct from the AI crawlers (GPTBot, ClaudeBot, PerplexityBot, etc.) that build training datasets and search indices on a scheduled basis. AI user bots are demand-driven: they only show up when a user is actively asking a question that involves your content. That distinction matters. A spike in Claude-User requests means Claude is referencing your pages when responding to users in real time. You still don’t know if you got a citation, but it’s about as direct a signal as you can get for AI visibility.
One important caveat: the above-mentioned prompt monitoring tools also count as “users”. I.e., when Profound or SEMrush or some other platform submits a prompt, it can also trigger a user bot visit.
Why Cloudflare Is a Great Source for This Data
Google Analytics blocks known bots and spiders, and bots like these don’t tend to execute tracking tags anyway, so no tag-based analytics tool will do any better. To get at these requests, you need access to HTTP server request logs. Your website hosting provider might be able to give you access to them, but if you use a CDN like Cloudflare or Akamai, your hosting provider’s logs will be incomplete. Web server log files are also massive and ponderous to deal with.
If you use Cloudflare, it sits in front of your server and sees every request, and Cloudflare provides an interface for querying logs to get just what you need, either in the user interface or via an API.
A note on cost: to do the things described in this post, you will need to enable Log Explorer, which is a paid add-on and is priced based on log volume. For twooctobers.com, which tracks about 10k sessions per month in GA, the cost is only about $2/month on top of our $25/month Cloudflare Pro subscription. Note that the pipeline described below uses the GraphQL Analytics API, which is available on the Pro plan or better.
Exploring the Data In the Cloudflare UI
Once you have enabled Log Explorer, you can query your raw HTTP request logs directly from the dashboard using standard SQL. Further down, I describe how to extract this data programmatically via the API, but you can do a lot directly in the interface. Even if you plan to go the API route, I recommend exploring the data in the UI in order to get a feeling for the data.
To run queries in the UI, navigate to your domain → Log Explorer → Log Search, then select Custom SQL to open the query editor.
Log Explorer stores raw, request-level logs — so the query below uses COUNT(*) with GROUP BY to aggregate request counts, which is conceptually the same as what the pipeline does before writing to BigQuery.
Query Requests by Bot, Date, and Page
This is similar to the data the pipeline stores — user agent, date, requested path, and request count. It is useful for identifying which specific pages AI assistants are fetching most frequently.
SELECT
  Date,
  ClientRequestUserAgent,
  ClientRequestPath,
  COUNT(*) AS requests
FROM http_requests
WHERE Date >= '2026-04-17'
  AND Date <= '2026-04-23'
  AND (
    ClientRequestUserAgent LIKE '%Claude-User%'
    OR ClientRequestUserAgent LIKE '%ChatGPT-User%'
    OR ClientRequestUserAgent LIKE '%Perplexity-User%'
  )
GROUP BY Date, ClientRequestUserAgent, ClientRequestPath
ORDER BY requests DESC
Adjust the date range as needed — Log Explorer’s retention window is 30 days on the Pro plan.
Log Explorer lets you save queries for reuse — worth doing once you’ve settled on a format you like.
The Pipeline: Cloudflare → BigQuery
To get long-term trend data, I built a small pipeline that runs daily and loads the previous day’s bot request data into BigQuery. The code is available on GitHub. The GitHub repo has step-by-step setup instructions, suitable for human or LLM consumption 😉
I fussed about a bit to get the query right, but Codex or Claude Code can easily translate the rest of the process to your environment.
What It Does
A GCP Cloud Run Python script (extract.py) queries the Cloudflare GraphQL API for the httpRequestsAdaptiveGroups dataset — the same dataset the queries above use — and loads the results into a BigQuery table partitioned by date. Each row represents a unique combination of date, user agent, verified bot category, and requested path, with a request count.
The script also fetches request data for a variety of AI training and search engine bots, including:
- Any bot on Cloudflare’s verified bot list. Technically, it will fetch as long as the verified_bot_category field has a value. Cloudflare verifies bots based on the user agent and with a reverse-IP lookup, so verified user agents may not have a verified_bot_category value if the IP lookup failed.
- Any bot on an explicit allow list that is built into the script. The allow list includes major search engine crawlers, common AI bots and a few others. The README.md file documents the full list, and you can add/update by modifying the BOT_FAMILIES variable in extract.py.
A few details worth knowing:
- Spoofed user agents may show up. Bad actors sometimes spoof user agents in order to get around web application firewalls (WAFs). This is likely a small amount of noise for most sites, but worth knowing.
- Static assets are filtered out. CSS, JavaScript, images, fonts, video — anything that isn’t a page or document-like resource — is excluded. The ASSET_EXTENSIONS list in the script covers the common cases and is easy to edit.
- The lookback window handles gaps automatically. The default run checks the last 7 days and only fetches dates that aren’t already in BigQuery. If a run fails, it self-heals on the next execution. Note that with a Pro plan, you can only query the last 8 days via the API, so daily runs are important to avoid gaps.
- The Cloudflare API uses adaptive sampling on high-volume zones. This means that the request counts from this pipeline may not exactly match what you see in the Cloudflare dashboard if you are working with a high-traffic website.
The BigQuery Table
The schema is straightforward:
| Field | Type | Description |
|---|---|---|
date | DATE | UTC date of the requests |
user_agent | STRING | Raw user agent string from the request |
bot_family | STRING | Normalized bot name from the script’s allowlist (e.g. Claude-User, Googlebot); null if the row was kept only because verified_bot_category was set |
verified_bot_category | STRING | Cloudflare’s classification (AI Assistant, AI Crawler, etc.); null for bots not in Cloudflare’s verified program |
path | STRING | The requested URL path |
requests | INT64 | Request count |
Once data is accumulating, a few useful queries:
AI assistant traffic trend by day:
SELECT
  date,
  bot_family,
  SUM(requests) AS requests
FROM `YOUR_PROJECT.cloudflare_analytics.user_agent_requests_daily`
WHERE bot_family IN ('Claude-User', 'ChatGPT-User', 'Perplexity-User')
AND date BETWEEN '2026-05-01' AND '2026-05-07'
GROUP BY 1, 2
ORDER BY 1 DESC;
Top pages being fetched by AI assistants:
SELECT
  path,
  SUM(requests) AS requests
FROM `YOUR_PROJECT.cloudflare_analytics.user_agent_requests_daily`
WHERE bot_family IN ('Claude-User', 'ChatGPT-User', 'Perplexity-User')
AND date BETWEEN '2026-05-01' AND '2026-05-07'
GROUP BY 1
ORDER BY requests DESC
LIMIT 20;
Deployment
The repo includes a Dockerfile and full instructions for running the script on a daily schedule via Cloud Run Jobs + Cloud Scheduler. Setup takes about 15 minutes if you’re already comfortable with GCP. The README walks through everything: creating the BigQuery dataset and table, storing the Cloudflare API token in Secret Manager, building and deploying the container, and scheduling the daily run.
You can also run the script locally via the command line:
pip install -r requirements.txt
python extract.py --days 7  # initial backfill
python extract.py            # daily gap-fill
What to Do with This Data
I set this process up to shed light on which pages are being surfaced in AI answers, and to monitor how AI-driven access is growing or shifting over time. Once the data is in BigQuery, you can analyze and report on it with the tool of your choice. I set up a Data Studio dashboard to report on visit trends and the most visited pages.
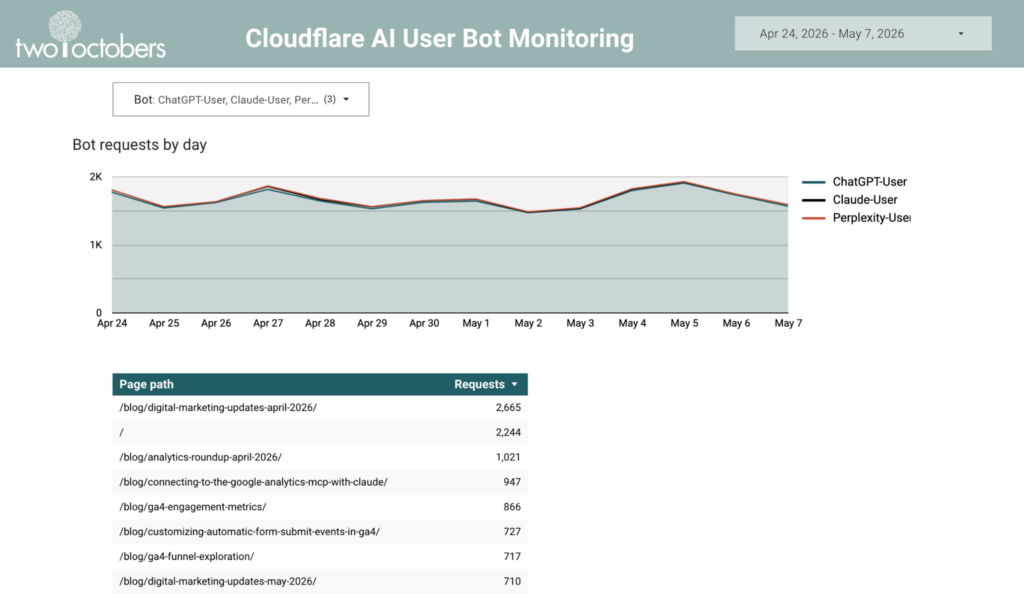
This is an easy way to monitor AI user bot behavior, and identify trending pages, but I’m more excited about using this as a data source in LLM tooling.
In that vein, I created a BigQuery Data Agent that connects to the Cloudflare data, GA session data and a WordPress export of page content and gave it some context on the business meaning of the data. I also added some verified queries to the agent to isolate LLM user bots in the Cloudflare logs and LLM referrers in the GA data.
It’s pretty freaking cool – with a very basic prompt it highlighted some real opportunities!
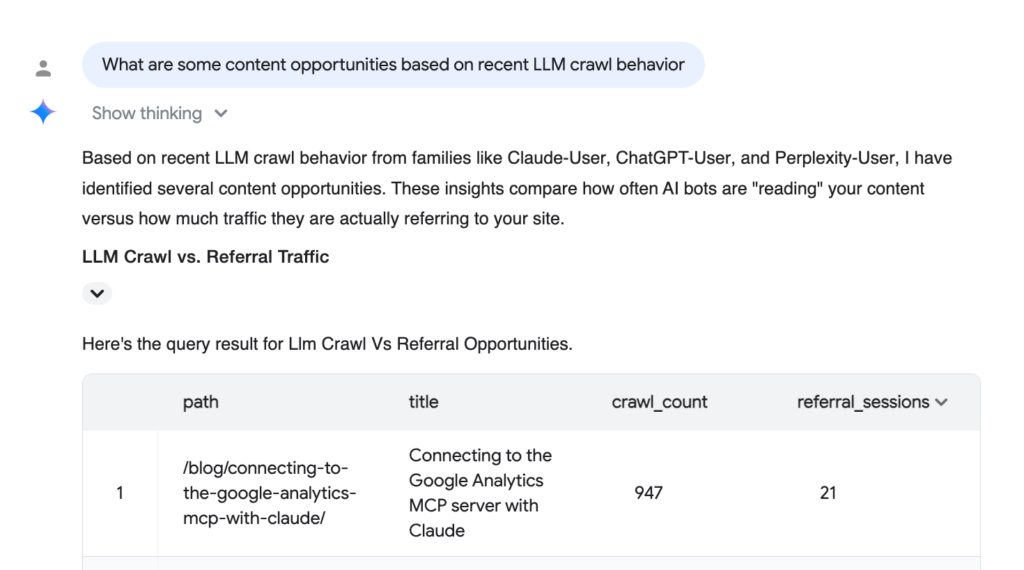
I’m still early in exploring what’s possible here, but the combination of real bot traffic data, session data, and actual page content gives the agent enough context to reason about AI visibility in a way that generic prompt-monitoring tools can’t. It’s the kind of analysis I expect we’ll be doing routinely in a year or two — the infrastructure is just getting ahead of the workflow.
My colleague Kris Skavish has more ideas: 5 Things AI-User Bot Data Can Tell You About Your AI Visiblity.
If you set this up and run into questions, or if you find other interesting ways to use the data, I’d love to hear about it. Comment below, or get in touch.
And check out my monthly roundup of analytics news and ideas on substack.