The bullet point version:
- If you aren’t using Google Tag Manager, go directly to jail; do not pass go, do not collect $200. This post is not for you.
- If you don’t have scroll tracking set up, follow the steps in Benjamin Mangold’s fabulous post, How to track scroll depth with Google Tag Manager.
- I also recommend setting up an event to track zero-percent scrolls. This event is equivalent to a page view, but it will make your scroll tracking report more useful. To do this, in Tag Manager:
- Add a new Google Analytics tag.
- Set Track Type to Event.
- For Category, use the same event category as your other scroll tracking events, the category is just ‘Scroll’ if you followed Benjamin’s post.
- Set the event action to 0%.
- Apply your Google Analytics settings variable. If you don’t know what this means, check out this Google Support article.
- Set Non-interaction Hit to TRUE.
- Apply the All Pages trigger.
- Save and Publish!
- If you are just getting scroll tracking set up, you’ll probably want to wait a week or two to accumulate data.
- Once you have some data, you are ready to analyze scroll depth! Benjamin Mangold also has a great webinar on this, but I’m going to show you a cool report he doesn’t cover:
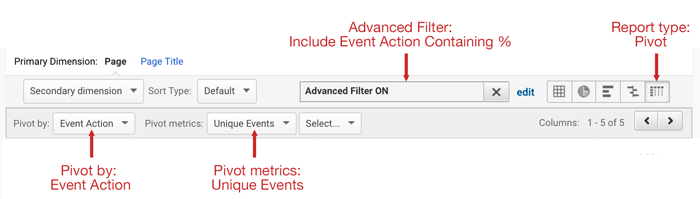
- In Google Analytics, go to Behavior > Events > Pages.
- Set the report type to Pivot
- Set Pivot by to Event Action
- Set Pivot metrics to Unique Events
- Add an Advanced Filter to include only Event Actions that contain a percent symbol
Voilá! If it all worked, your report should look something like this:
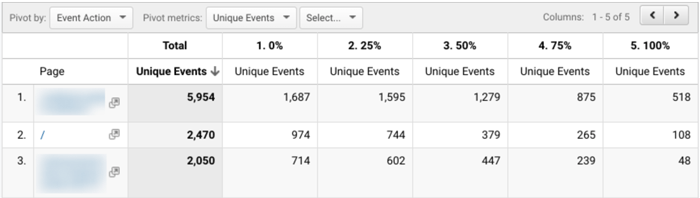
How cool is that! Happy analyzing!
Nico Brooks oversees analytics at Two Octobers, and organizes the Denver Google Analytics Meetup. He loves people who scroll 100% through his posts, and he loves connecting with those people even more!