 It’s really easy to add a comparison date range to a table in Looker Studio, you just enable ‘Comparison date range’ below ‘Default date range’ in the tables properties. This will add a column to the right of metrics showing percent change from the comparison period you specify.
The problem is, these comparison columns are not sortable. It’s nice to be able to see percent change, but sometimes you want to be able to see what has changed the most. We are going to accomplish this with a blend and the recently added conditional date filters.
Using trending organic queries as an example
As an example, we are going to build a report that shows the fastest growing organic queries based on clicks or impressions, using the Google Search Console data source, but the techniques here can be applied to any metric from any source.
See all the details in the text or video below.
Creating the blend
We’ll use a blend to get metrics from the last 30 days and metrics from the previous 30 days in the same dataset. Learn more about blends in my blog Mastering Data Blends: Looker Studio for Marketers.
- Add a Google Search Console Site Impression data source to your dashboard with search type ‘web’.
- Add a table to your dashboard with Query as the dimension and Impressions and Clicks as the metrics.

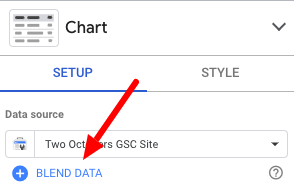
- Click ‘BLEND DATA’ below the data source name in the properties pane.
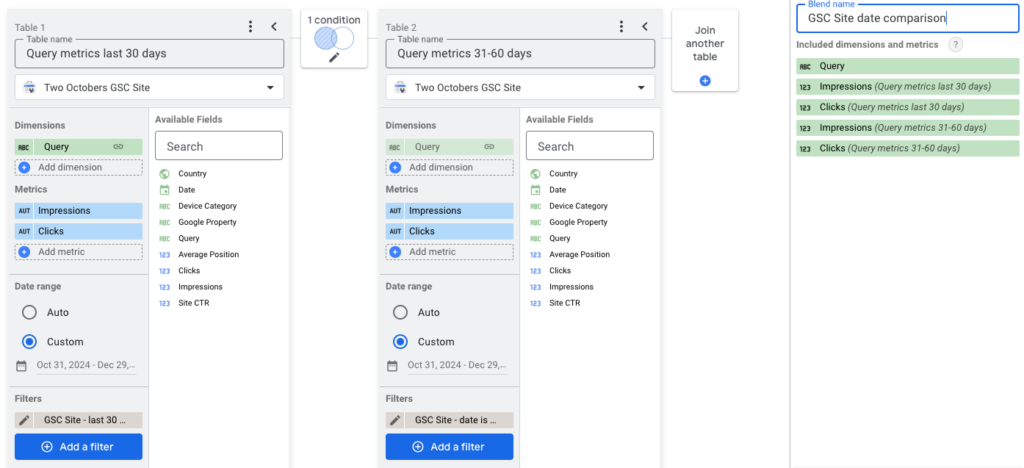
- Configure the blend
- Click ‘Join another table’ and add the same GSC Site Impression data source.
- Change the table names to ‘Query metrics last 30 days’ on the left, and ‘Query metrics 31-60 days’ on the right.
- Click ‘Configure join’ and set it to a Left outer join on Query.
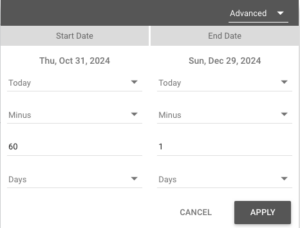
- Select Custom for the Date range for both data sources and select Advanced, then set the Start Date to minus 60 days and the End Date to minus 1 day.

- Add a filter to the left side of the blend to Include Date Is On or After 30 Days ago.

- Add a filter to the right side of the blend to Include Date Is Before 30 Days ago and Is On or After 60 Days ago.
- Name and save your blend. The configuration should look like this:

Configuring the table
- Change the date range of the table to the last 60 days using an advanced filter.
- Add Impressions from the right side of the blend as a metric. Hover over the left site of the metric widget, click the pencil icon, rename it ‘Prev. impressions’ in the pop-up.
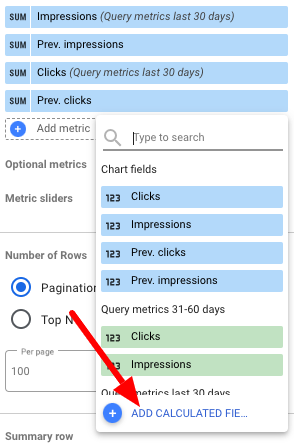
 Click to add a metric, and select ‘ADD CALCULATED FIELD’.
 - Set the formula to:
(Impressions (Query metrics last 30 days)-Impressions (Query metrics 31-60 days))/Impressions (Query metrics 31-60 days) - Set the Data Type to Percent and the Display Format to Percent(0), and set the name to ‘Impressions delta’.
- Repeat steps 3-5 for Clicks, naming it ‘Clicks delta’.
- Go to the Style pane on the properties panel and set Missing Data to show “ – “.
- Change the display format of your delta columns from Number to Heatmap.
- Play around with formatting however you’d like.
This is what the finished product looks like:

Now you can click on the delta columns to see your top gainers! You can also play around with conditional formatting or additional filters to just show queries with more than a certain number of impressions. Note that you have to apply filters in the blend configuration – applying them to the chart generally won’t work.
The ability to sort by rate of change is a useful tool for finding the most impactful changes in your marketing data.
![]() Dig deeper with our Looker Studio how-to blogs.
Dig deeper with our Looker Studio how-to blogs.


The calculated fields formula does not work for me. With an outer join, the named fields (imprssions) are not selectable, reverting to Impressionss (Query metrics last 30 days) with the keyword “metrics” not being recognized as text.
I recorded a video walkthrough of this process: https://youtu.be/N6VbdQxF414 – maybe see if there’s something I’m doing in the video that isn’t clear in the instructions above?
Great article, Nico! Your approach to making date comparisons sortable in Looker Studio is really useful. I’ve implemented similar blends in my dashboards, and I found that sometimes NULL values can affect the accuracy of the calculated fields, especially when dealing with organic search fluctuations.
To avoid issues with missing values and ensure more accurate comparisons, I use a slight modification in the formula:
This helps prevent division errors and provides a more balanced comparison when dealing with zero or missing values.
Thanks again for sharing all your knowledge! 🙂
This is great, thank you so much! I wish I could update the video posted to YouTube, but I’ll at least add your formula to the description (and give you credit).